
I am using Nmap every time I installed a new server/appliance/whatever in order to check some unknown open ports from the outside. In most situations I am only doing a very basic run of Nmap without additional options or NSE scripts.
Likewise I am interested in how the Nmap connections appear on the wire. Hence I captured a complete Nmap run (TCP and UDP) and had a look at it with Wireshark. If you’re interested too, feel free to download the following pcap and have a look at it by yourself. At least I took some Wireshark screenshots to give a first glance about the scan.
Laboratory
Not much to say about the “lab” this time. A fresh Ubuntu 16.04.3 LTS server with Nmap 7.60. I scanned the well-known scanme.nmap.org domain with TCP and UDP via IPv6: sudo nmap -6 -sS -sU -A scanme.nmap.org . In order to have a complete transparent capture I used a Profitap ProfiShark 1G network TAP rather than tcpdump on the scanning host itself:
From a 100 Mbps Hub to a #ProfiShark Gigabit TAP. I just dramatically increased my network troubleshooting hardware! #tschakka @Profitap pic.twitter.com/67dO5JH0sV
— Johannes Weber ? (@webernetz) October 24, 2017
These are the mere Nmap results. Only four open ports were found while 1996 ports are closed. The host seems to be a Ubuntu Linux machine:
|
1 2 3 4 5 6 7 8 9 10 11 12 13 14 15 16 17 18 19 20 21 22 23 24 25 26 27 28 29 30 31 32 33 34 35 36 37 38 39 40 41 42 43 44 45 46 47 48 49 50 51 52 53 54 55 56 57 58 59 60 61 62 63 64 65 66 67 68 69 70 71 72 73 74 75 |
# Nmap 7.60 scan initiated Mon Oct 30 21:50:31 2017 as: nmap -6 -sS -sU -A -oN nmap-default-scan scanme.nmap.org Nmap scan report for scanme.nmap.org (2600:3c01::f03c:91ff:fe18:bb2f) Host is up (0.16s latency). Other addresses for scanme.nmap.org (not scanned): 45.33.32.156 Not shown: 1996 closed ports PORT STATE SERVICE VERSION 22/tcp open ssh OpenSSH 6.6.1p1 Ubuntu 2ubuntu2.8 (Ubuntu Linux; protocol 2.0) | ssh-hostkey: | 1024 ac:00:a0:1a:82:ff:cc:55:99:dc:67:2b:34:97:6b:75 (DSA) | 2048 20:3d:2d:44:62:2a:b0:5a:9d:b5:b3:05:14:c2:a6:b2 (RSA) | 256 96:02:bb:5e:57:54:1c:4e:45:2f:56:4c:4a:24:b2:57 (ECDSA) |_ 256 33:fa:91:0f:e0:e1:7b:1f:6d:05:a2:b0:f1:54:41:56 (EdDSA) 80/tcp open http Apache httpd 2.4.7 ((Ubuntu)) |_http-server-header: Apache/2.4.7 (Ubuntu) |_http-title: Go ahead and ScanMe! 31337/tcp open tcpwrapped 123/udp open ntp NTP v4 (secondary server) | ntp-info: |_ No OS matches for host (If you know what OS is running on it, see https://nmap.org/submit/ ). TCP/IP fingerprint: OS:SCAN(V=7.60%E=6%D=10/30%OT=22%CT=1%CU=2%PV=N%DS=16%DC=T%G=Y%TM=59F790F5 OS:%P=x86_64-unknown-linux-gnu)S1(P=600123c100280638XX{32}0016d65528a109e4 OS:31a1cdd7a0126f90b63f0000020405a00402080ad5bc95d7ff{4}01030307%ST=0.0490 OS:08%RT=0.212213)S2(P=600ebcd400280637XX{32}0016d656866902c931a1cdd8a0126 OS:f905f710000020405a00402080ad5bc95f6ff{4}01030307%ST=0.149357%RT=0.31680 OS:2)S3(P=60011e7400280637XX{32}0016d6577372765431a1cdd9a0126f9001c1000002 OS:0405a00101080ad5bc9611ff{4}01030307%ST=0.24934%RT=0.40728)S4(P=6007b053 OS:00280637XX{32}0016d6589b3ffd3d31a1cddaa0126f904fe80000020405a00402080ad OS:5bc9630ff{4}01030307%ST=0.349026%RT=0.509484)S5(P=600ae49800280637XX{32 OS:}0016d6590435332e31a1cddba0126f90b0e10000020405a00402080ad5bc964fff{4}0 OS:1030307%ST=0.449244%RT=0.613608)S6(P=600a46d700240638XX{32}0016d65a5d37 OS:688731a1cddc90126f9036760000020405a00402080ad5bc966bff{4}%ST=0.54903%RT OS:=0.707151)U1(P=600c8e7401643a37XX{32}0104bad900{4}6001234501341118XX{32 OS:}d67f000201340f6543{300}%ST=0.672676%RT=0.839129)TECN(P=600c71700020063 OS:8XX{32}0016d65b44b0eeb831a1cddd8052708046c50000020405a00101040201030307 OS:%ST=0.722681%RT=0.877663)T4(P=6002f58c00140637XX{32}0016d65e5fee489000{ OS:4}5004000082b70000%ST=0.871681%RT=1.03341)T5(P=600b259600140638XX{32}00 OS:01d65f00{4}31a1cde1501400002bb70000%ST=0.921211%RT=1.08249)T6(P=6004bcb OS:500140638XX{32}0001d660b654f5ae00{4}500400007f450000%ST=0.970713%RT=1.1 OS:32)T7(P=600e17ef00140638XX{32}0001d66100{4}31a1cde3501400002bb30000%ST= OS:1.02032%RT=1.17591)EXTRA(FL=12345) Network Distance: 16 hops Service Info: OS: Linux; CPE: cpe:/o:linux:linux_kernel Host script results: | address-info: | IPv6 EUI-64: | MAC address: | address: f2:3c:91:18:bb:2f |_ manuf: Unknown |_clock-skew: mean: 13s, deviation: 0s, median: 13s TRACEROUTE (using port 80/tcp) HOP RTT ADDRESS 1 1.09 ms fritz.box (2003:50:aa1c:c600:ca0e:14ff:fe7e:339f) 2 2.86 ms 2003:0:1301:4205::1 3 6.93 ms 2003:0:1308:338::2 4 3.59 ms 2003:0:1307:400a::1 5 2.95 ms 2003:0:1307:400a::2 6 2.87 ms ae-24.r24.frnkge08.de.bb.gin.ntt.net (2001:728:0:2000::1b1) 7 92.72 ms ae-4.r25.nycmny01.us.bb.gin.ntt.net (2001:418:0:2000::65) 8 91.49 ms ae-1.r24.nycmny01.us.bb.gin.ntt.net (2001:418:0:2000::27d) 9 172.96 ms ae-2.r20.sttlwa01.us.bb.gin.ntt.net (2001:418:0:2000::71) 10 157.65 ms ae-0.r21.sttlwa01.us.bb.gin.ntt.net (2001:418:0:2000::e6) 11 165.29 ms ae-3.r23.snjsca04.us.bb.gin.ntt.net (2001:418:0:2000::155) 12 171.11 ms ae-41.r02.snjsca04.us.bb.gin.ntt.net (2001:418:0:2000::f6) 13 168.47 ms ae-0.a02.snjsca04.us.bb.gin.ntt.net (2001:418:0:2000::2f2) 14 168.79 ms 2001:418:0:5000::afd 15 165.88 ms 2600:3c01:3333:7::2 16 161.31 ms scanme.nmap.org (2600:3c01::f03c:91ff:fe18:bb2f) OS and Service detection performed. Please report any incorrect results at https://nmap.org/submit/ . # Nmap done at Mon Oct 30 21:52:05 2017 -- 1 IP address (1 host up) scanned in 93.37 seconds |

pcap Download
If you want to play around with Wireshark download the following pcap and go:
![]()
Basic Analysis
Preface: It was not my intention to do a complete reverse engineering of Nmap. I just wanted to get a basic feeling about its connections. Hence here are just some quick notes.
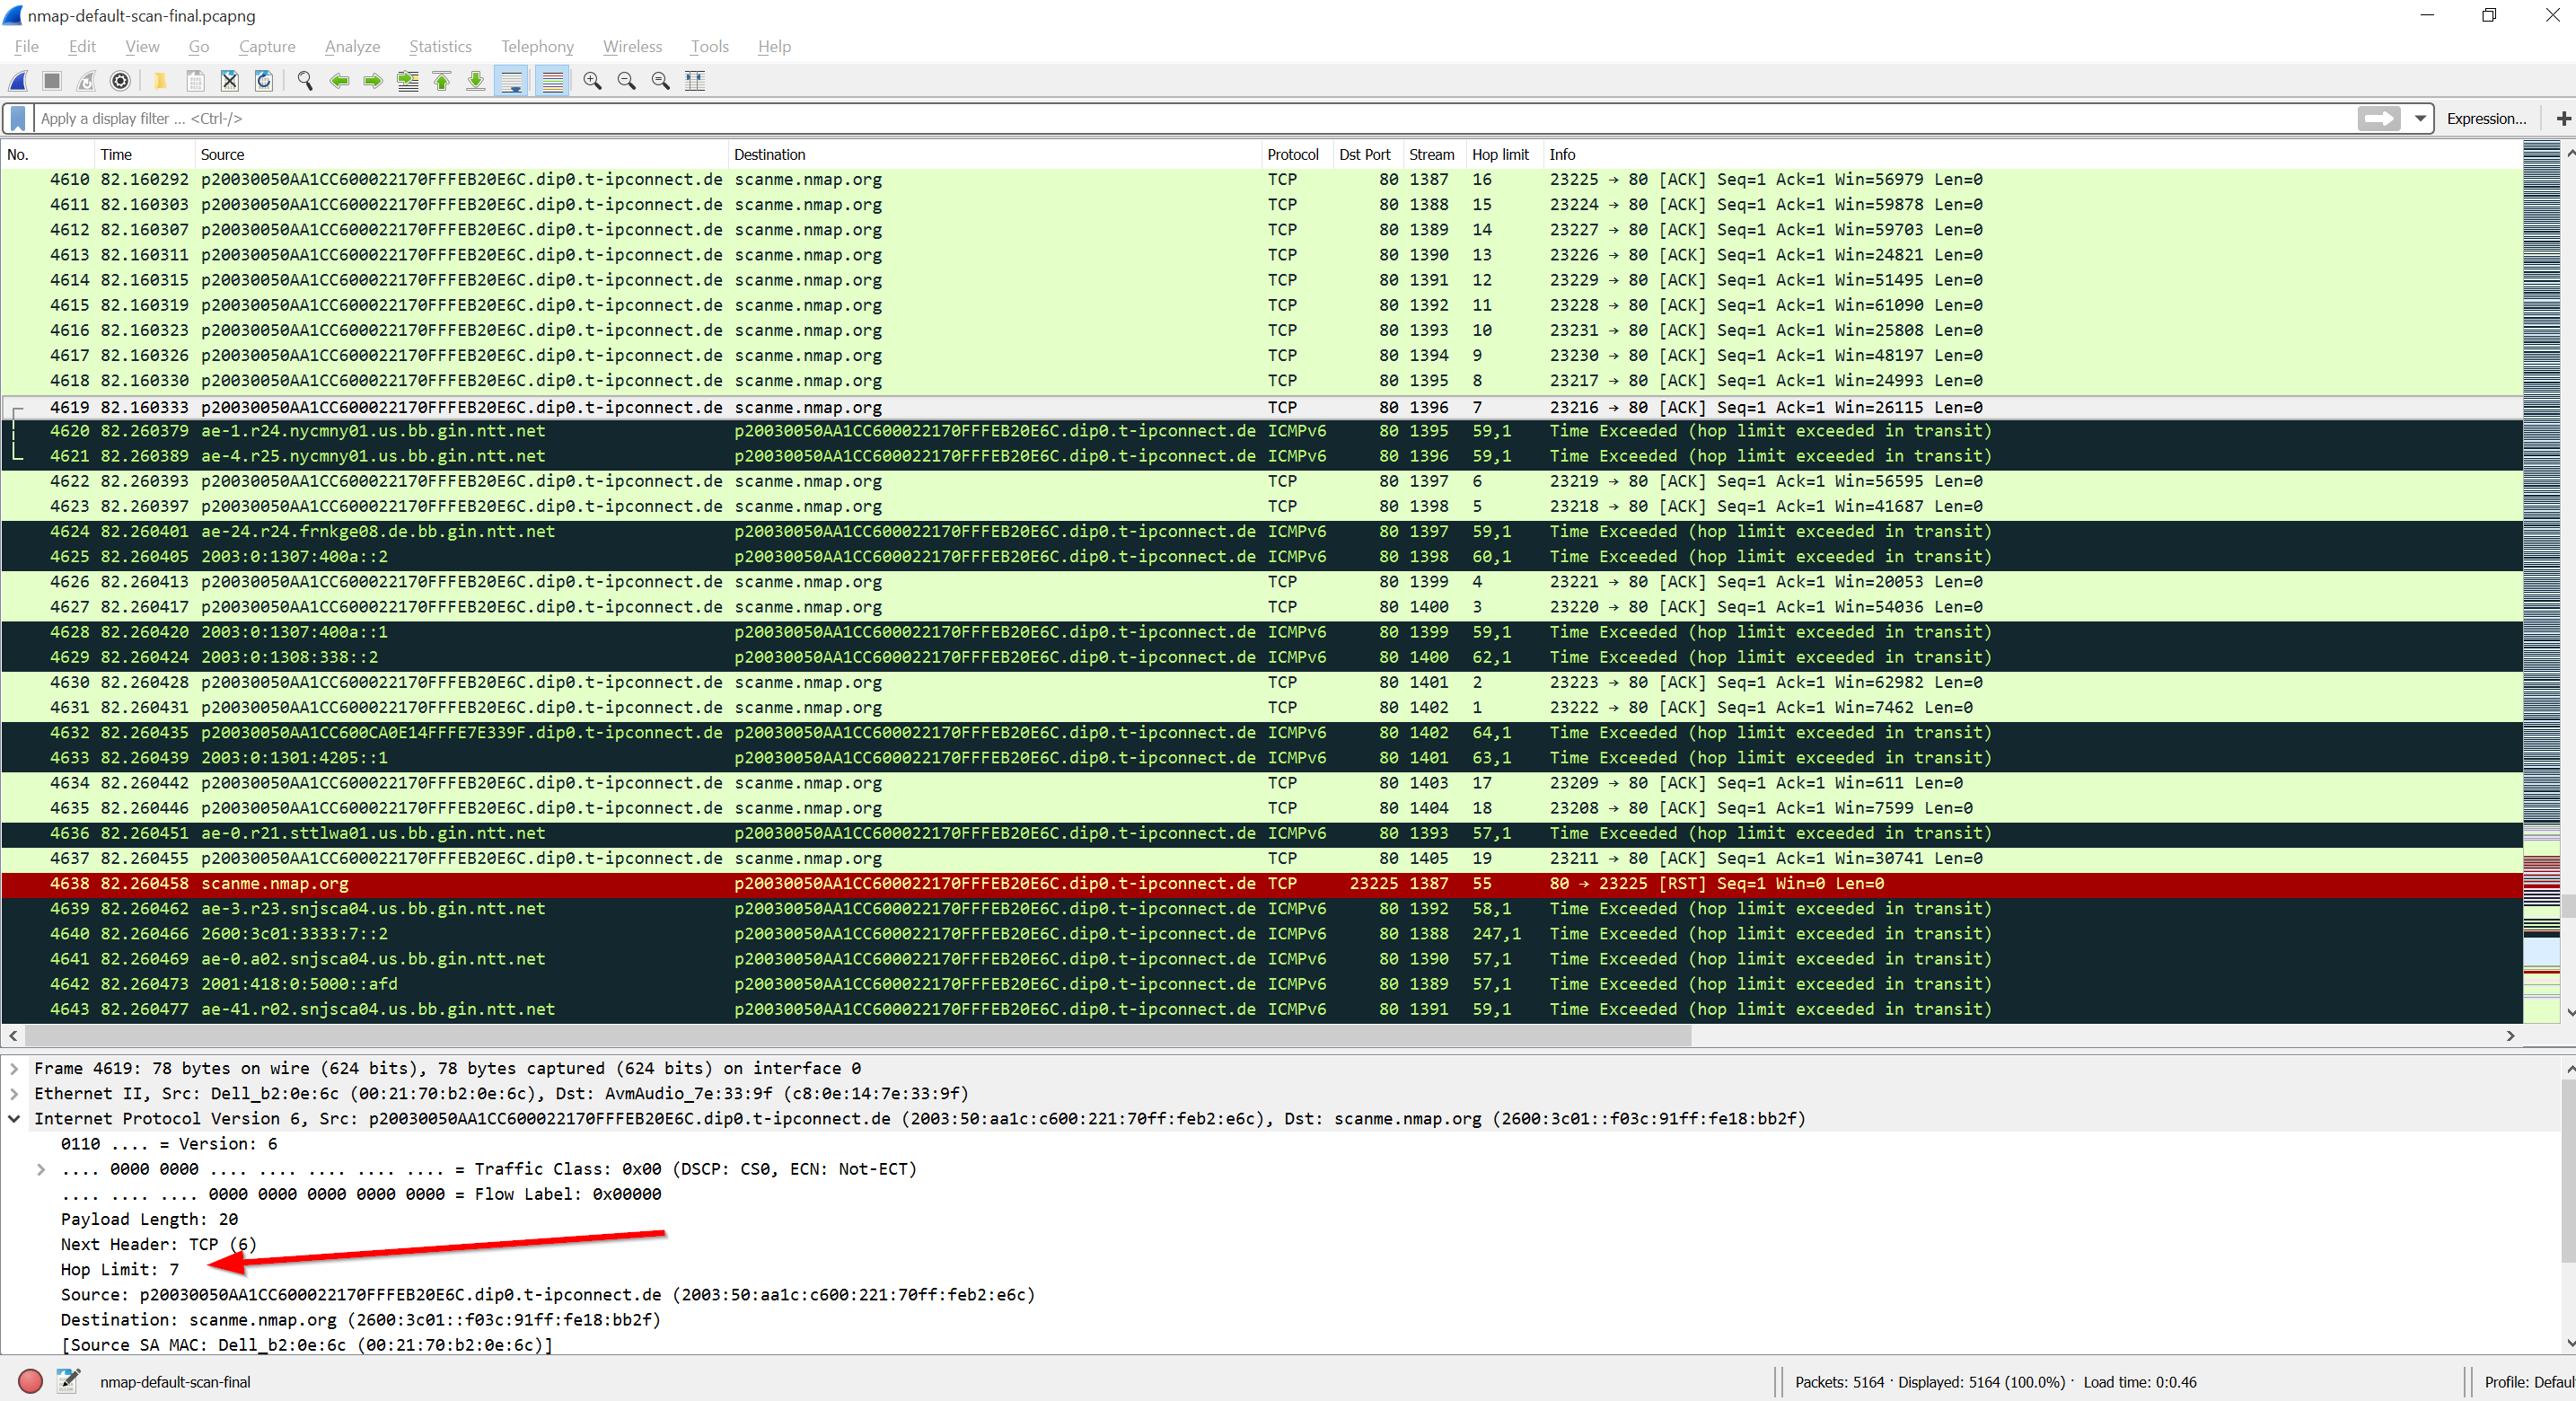
Beside the mere scan you can see some more packets, namely the initial DNS request to my local router (packets 1-4) and the traceroute at the end (beginning with packet 4610, Layer Four Traceroute with TCP Port 80) plus its reverse DNS lookups (packets 4645 to 4674, udp.stream eq 338 ):
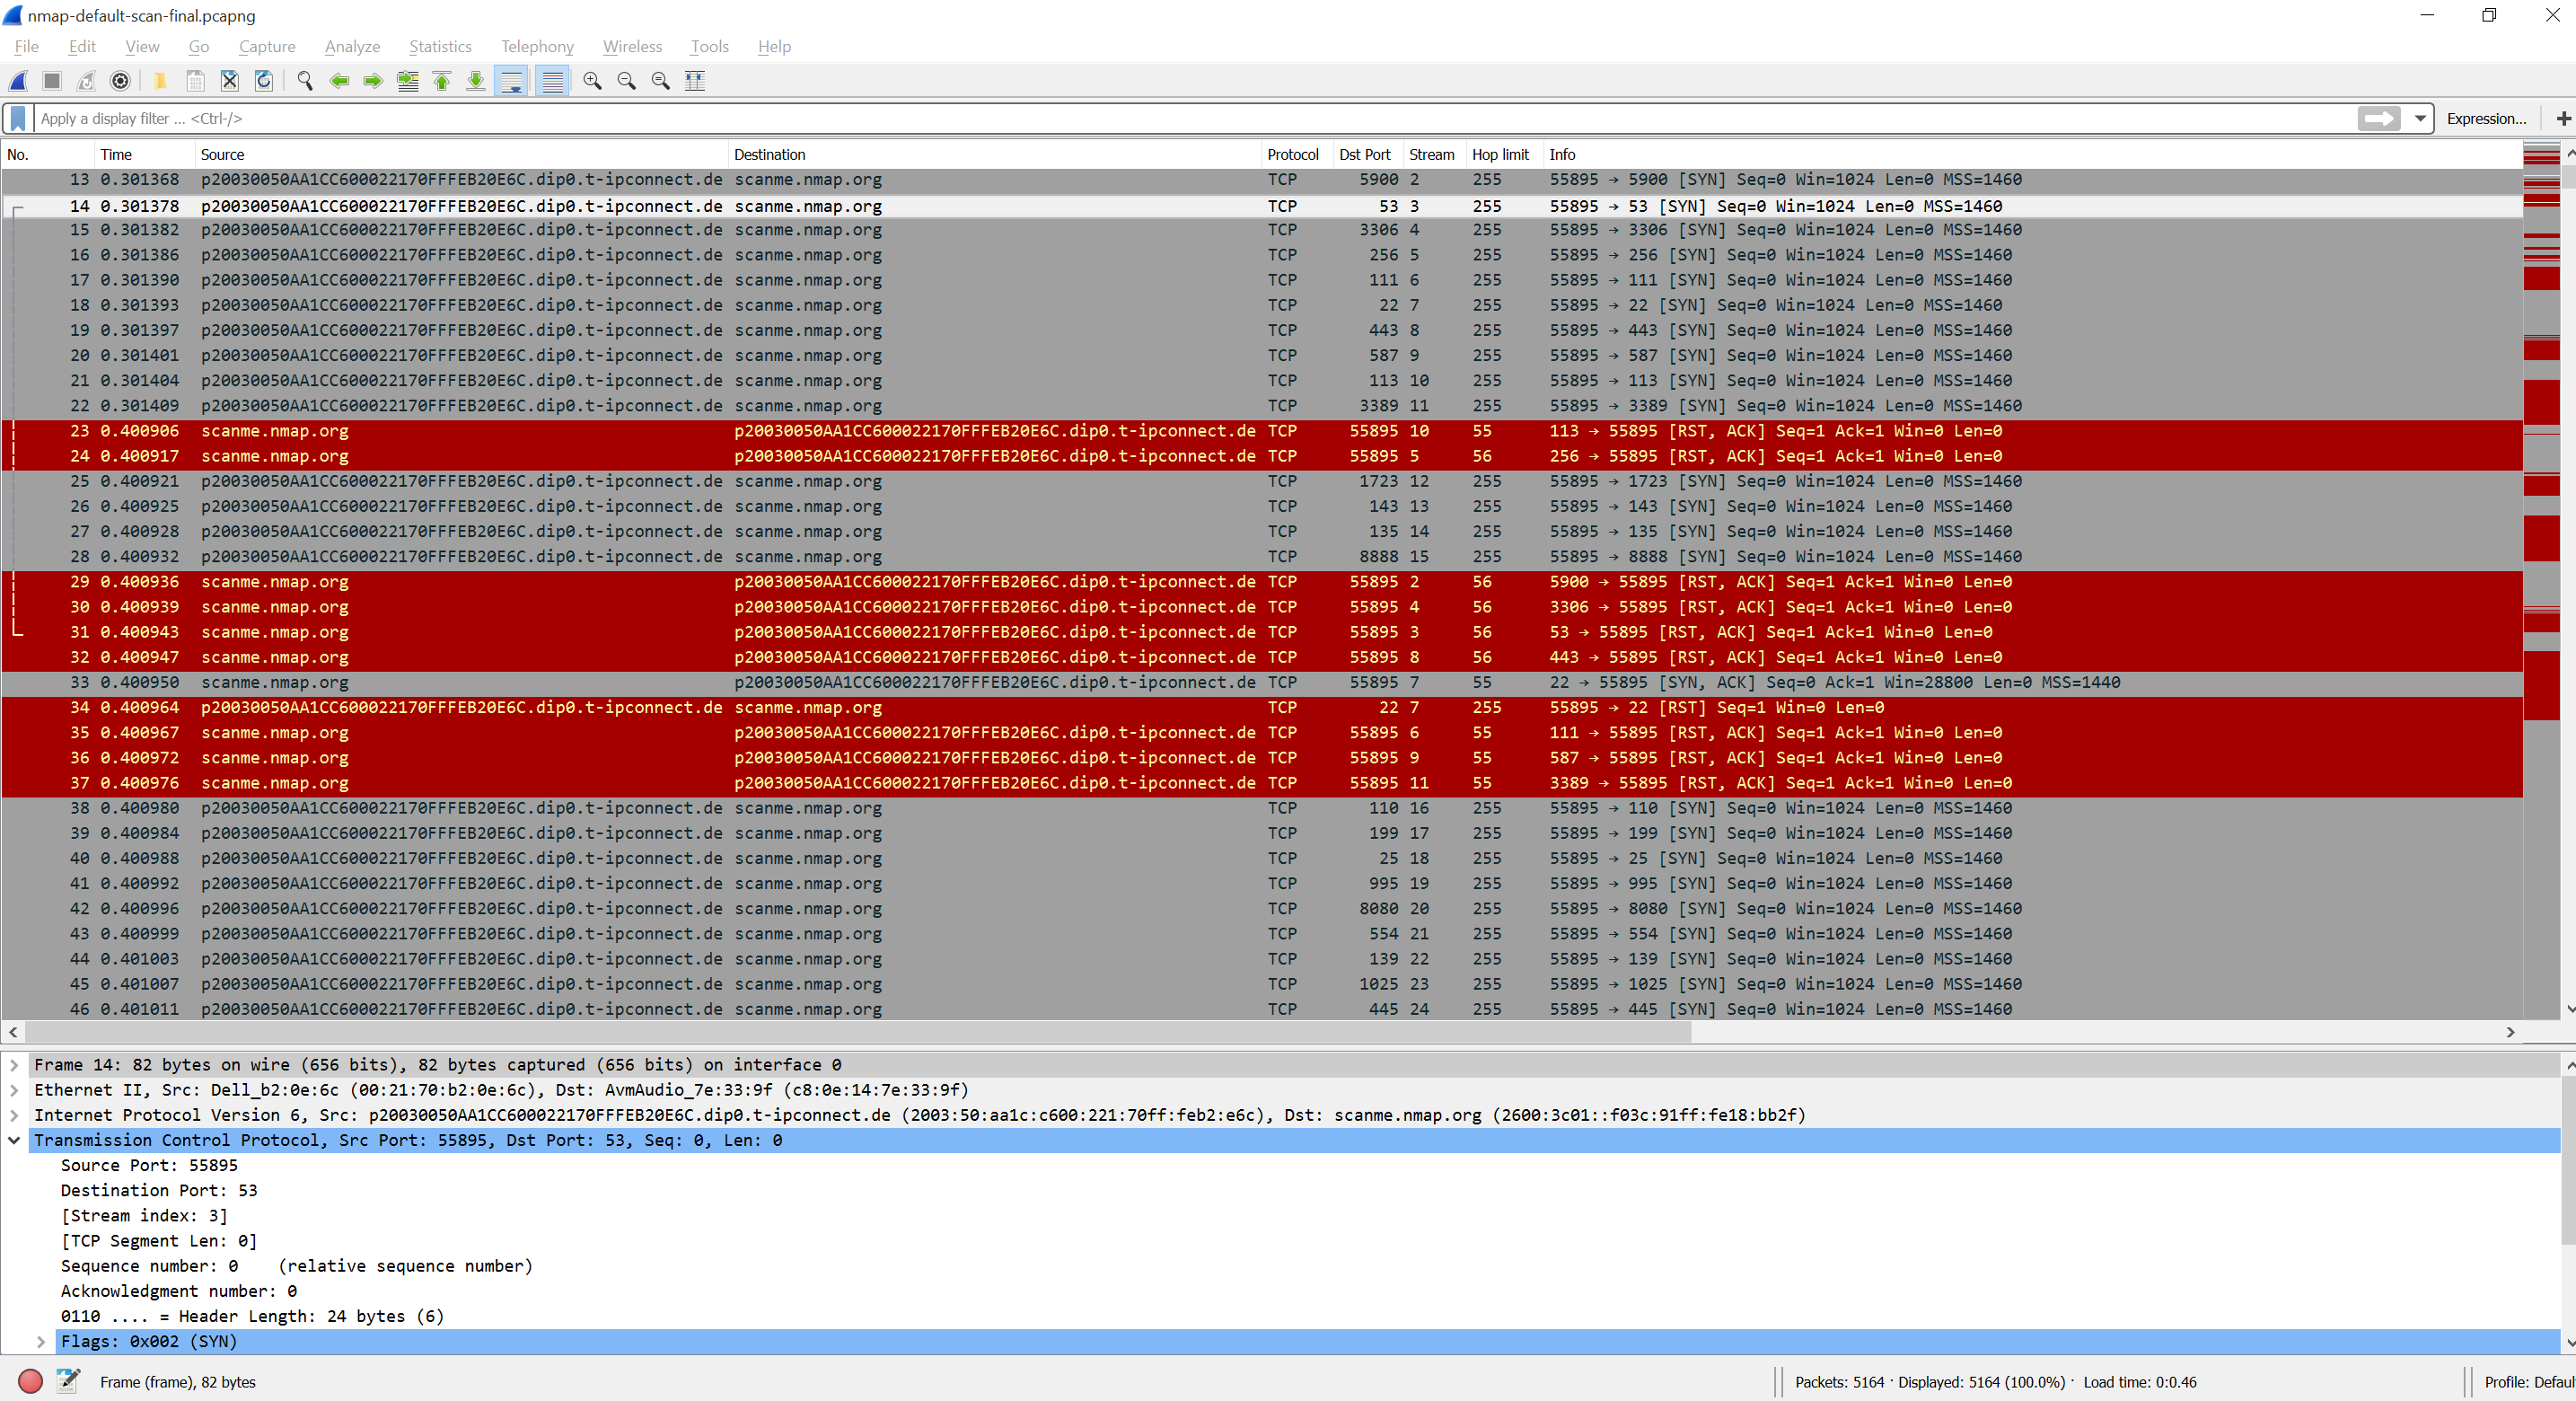
Since almost all ports are closed (rather than filtered in which no answers are received) there are many many many TCP RST respectively ICMPv6 destination unreachable (port unreachable for UDP connections) packets. The TCP scan started with packet no. 13, UDP with packet no. 2385:

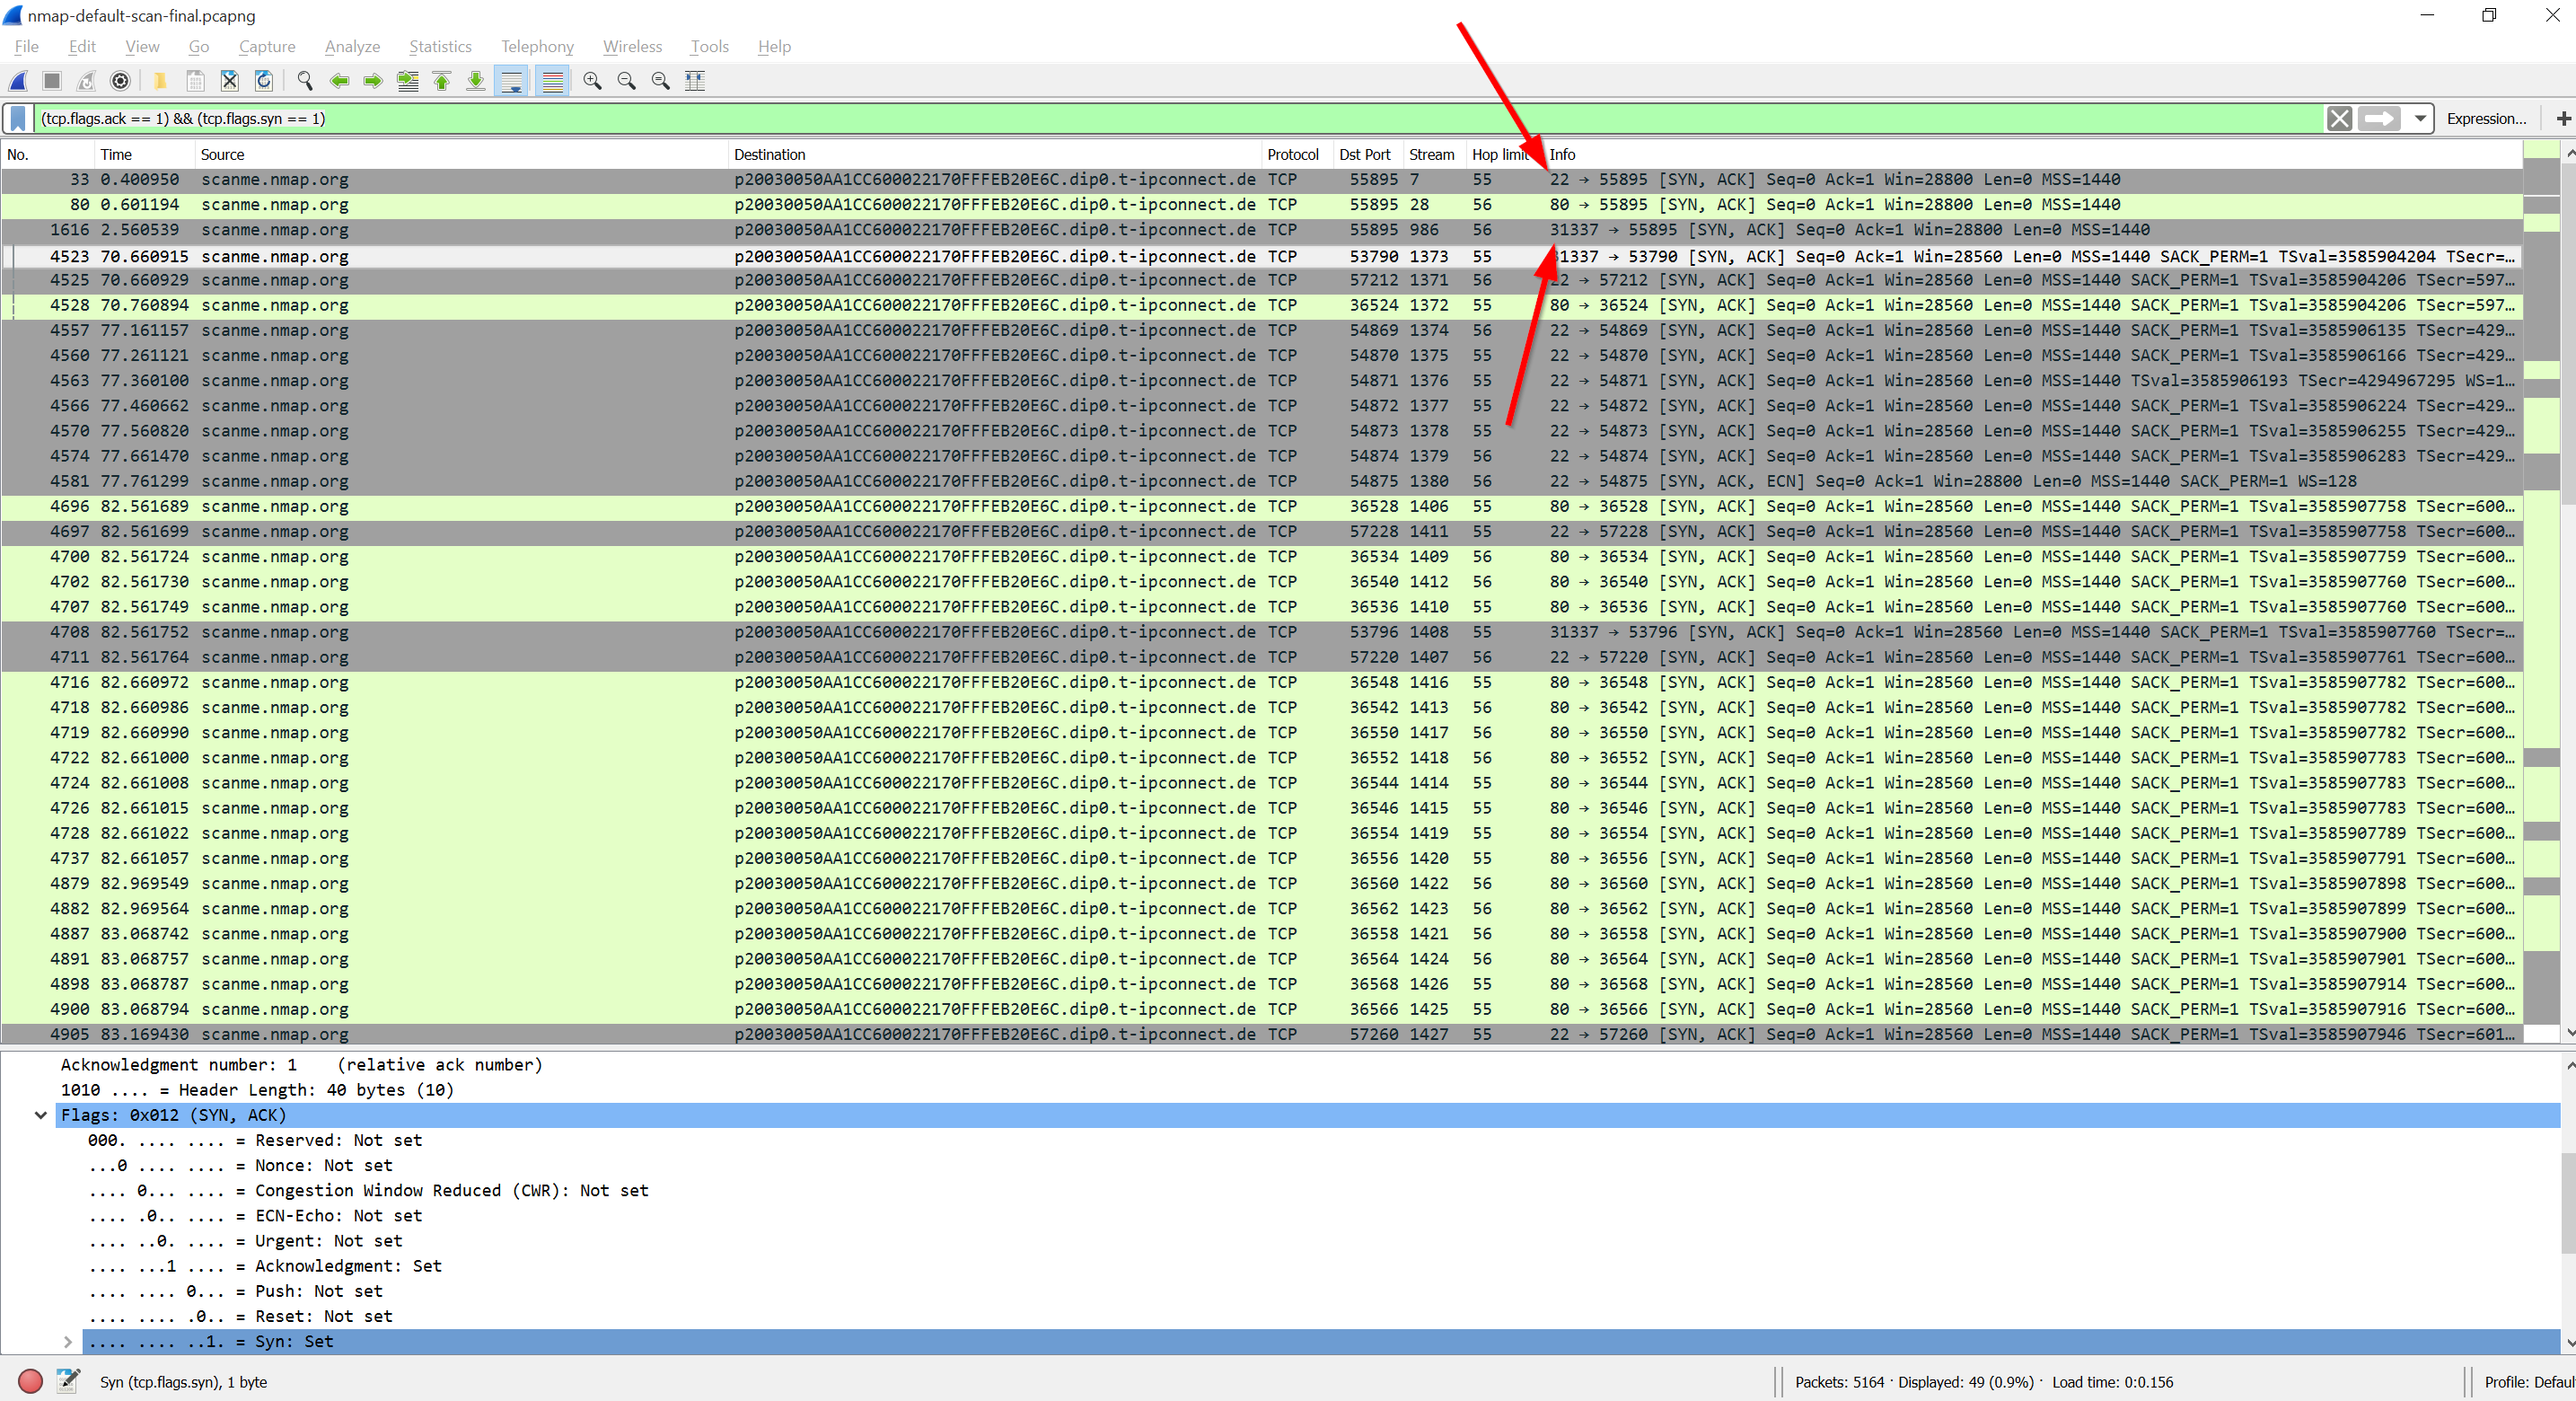
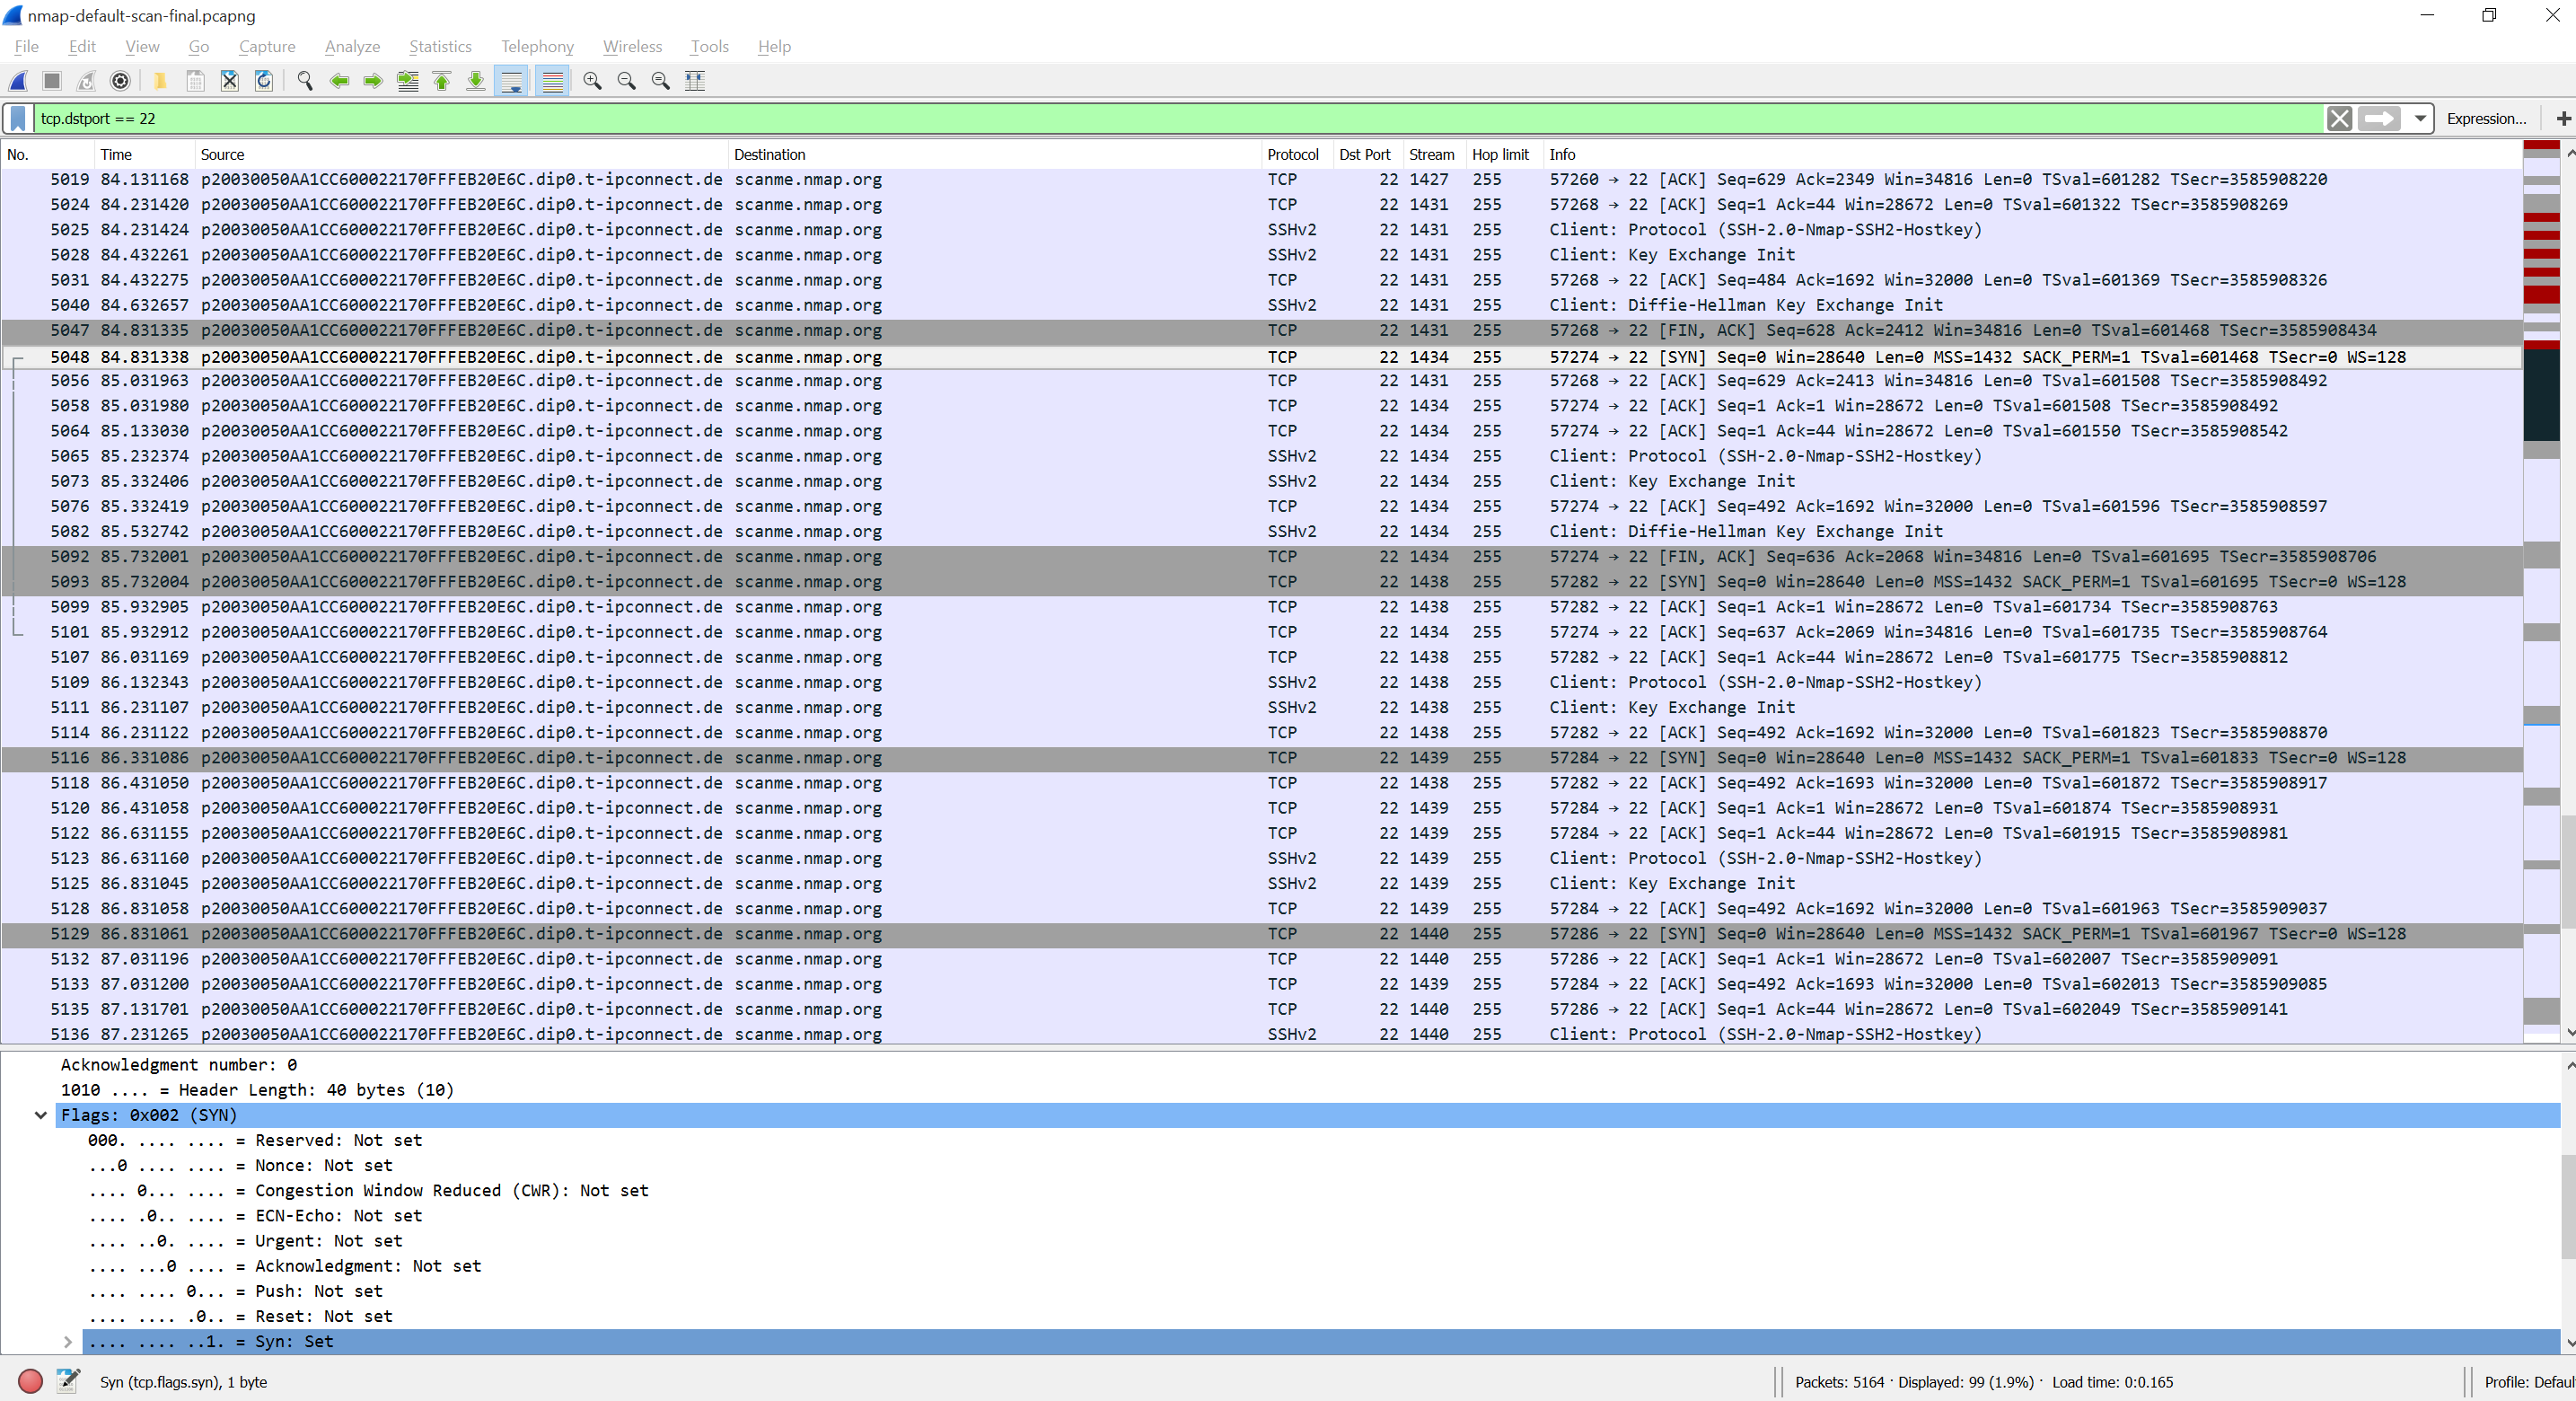
Filter for the TCP flags SYN & ACK to see the TCP connections that did succeed with its 3-way handshake (tcp.flags.ack == 1) && (tcp.flags.syn == 1) . You’ll find only the three open TCP ports 22, 80, 31337.
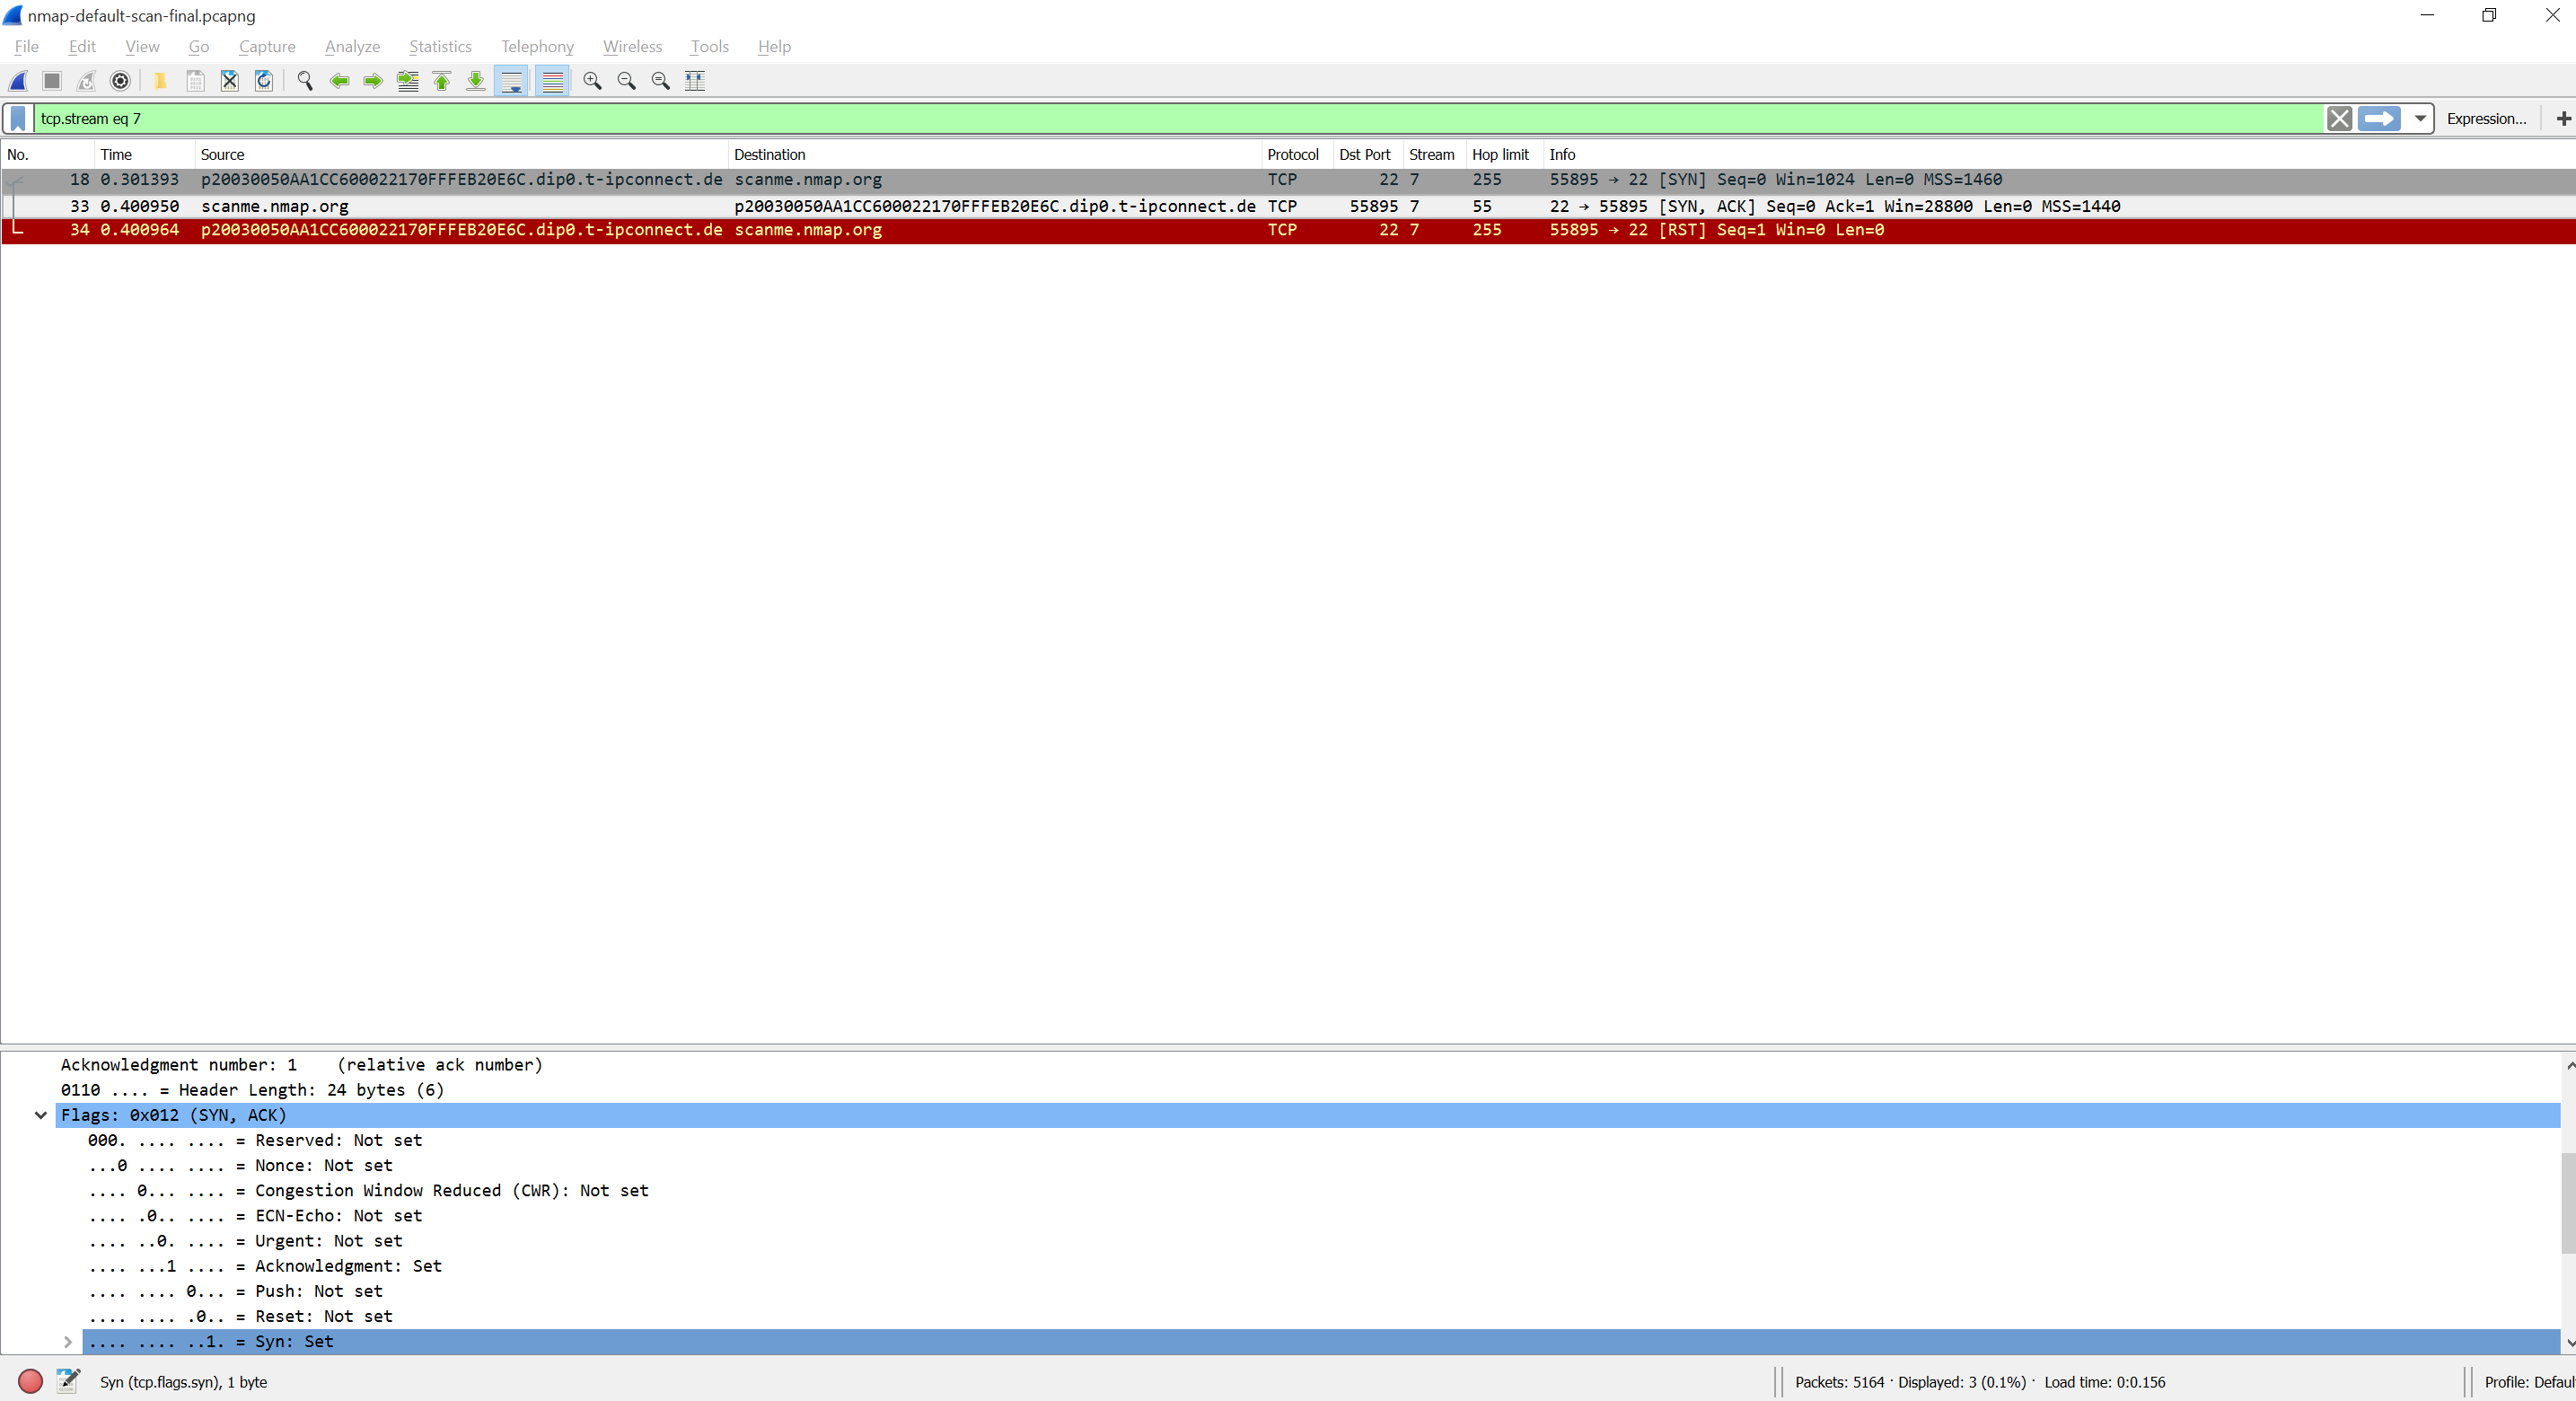
Note that the first run of the TCP scan did RST it immediately (e.g., tcp.stream eq 7 for TCP port 22) while Nmap later on uses more protocol aware scan techniques to discover the services behind the ports, such as SSH scan on port 22 which reveals the different public keys etc. Same is true for HTTP port 80.
For UDP it (sometimes) uses the application directly such as 53 DNS or 123 NTP while not for 514 Syslog:


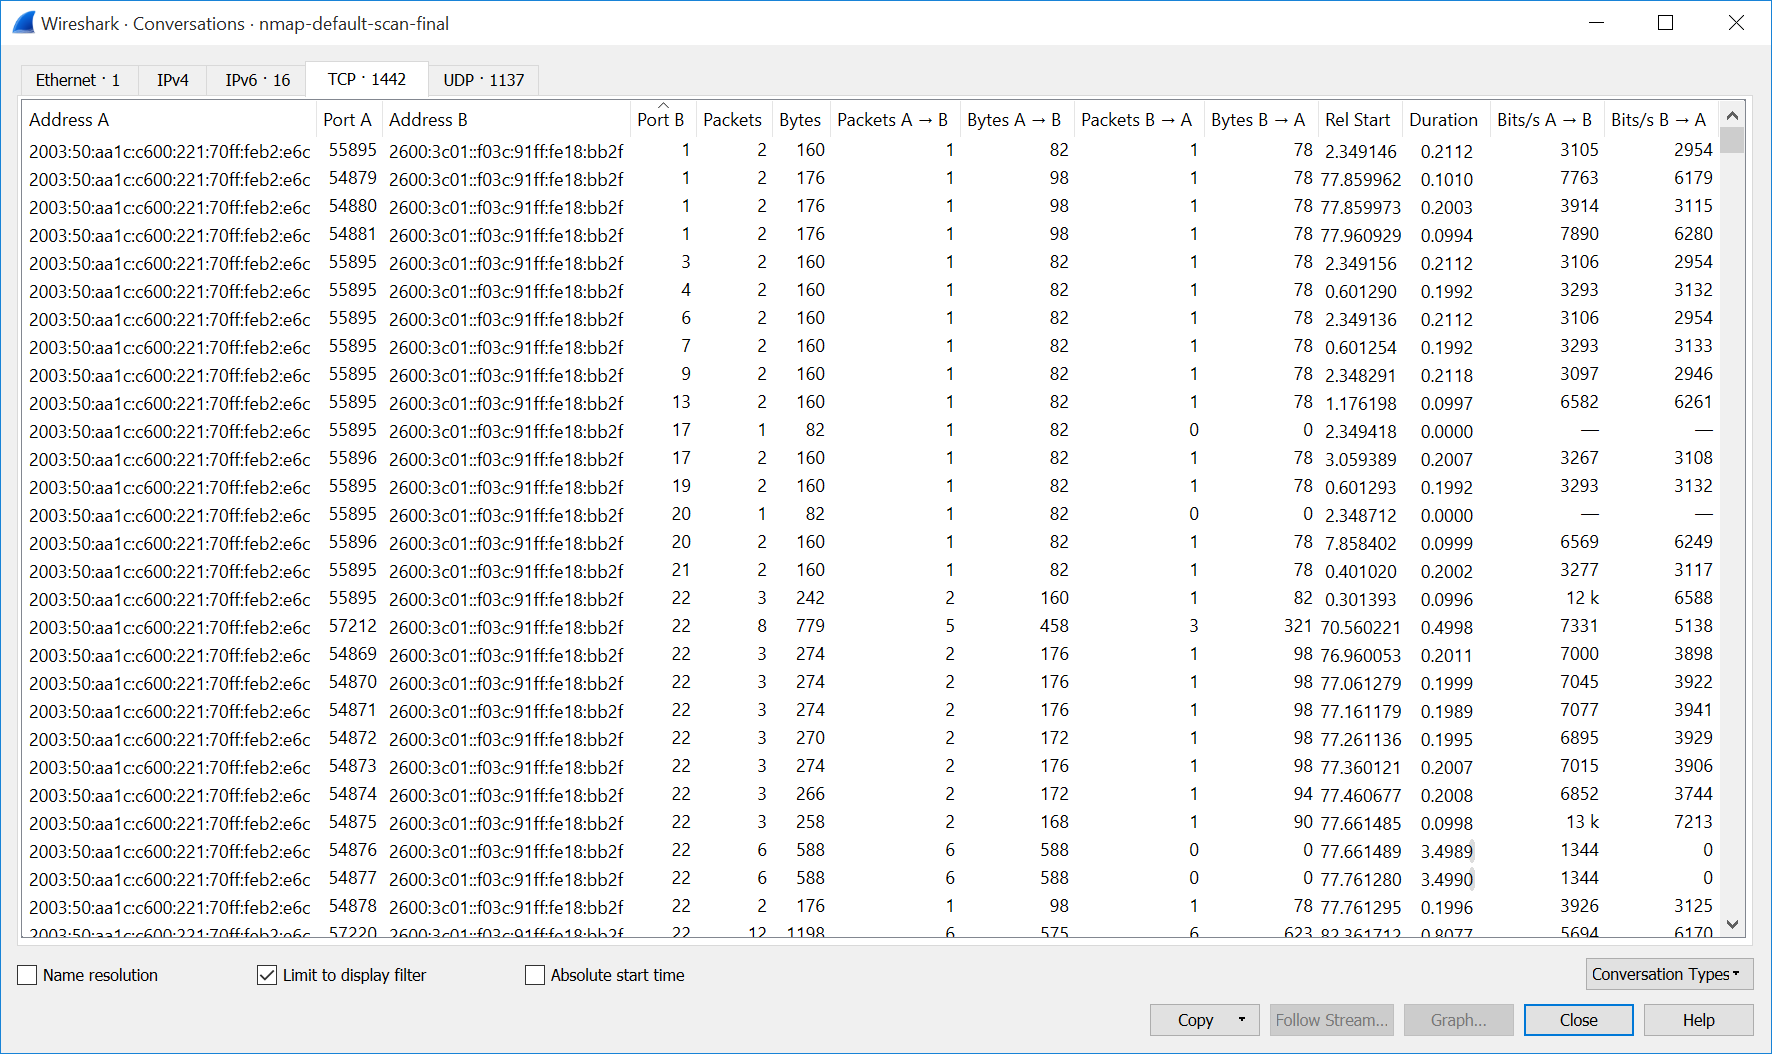
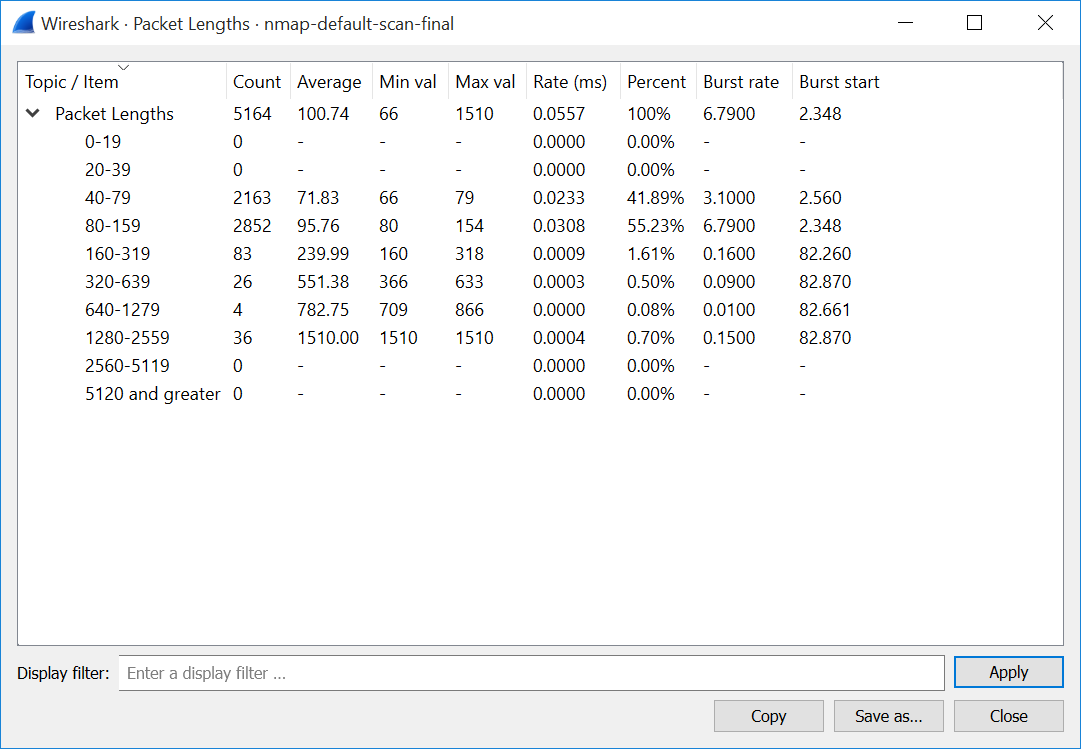
Finally you can use the basic Wireshark statistic options to get details about the TCP/UDP conversations, IO graphs and packet lengths. In my trace there are 1442 TCP and 1137 UDP conversations. The IO graphs shows a peak at the frist 5 seconds while it decreases to a lower level for the rest of the scan.


Featured image “In der Ferne … 196/366” by Dennis Skley is licensed under CC BY-ND 2.0.
Why is it that the traceroute starting at 4610 starts with a TTL of 16 and decrements down to 1? Isn’t that the opposite of how traceroute works? I’ve been mulling this over all morning and I’m baffled.
Wuh, that’s a very good question. And it’s decrementing from 16 to 1, while 17, 18, 19 are coming afterwards. Interesting.
However, as long as the corresponding ICMP “time exceeded” errors messages from the routers are interpreted correctly, it doesn’t matter at all whether the traceroute trick starts by 1 or by 16 or even shuffles it completely. For whatever reason Nmap is doing it that way…
Thank you so much for the quick reply! It’s a very unique pcap, I’ve never seen traceroute behave that way before.
Here’s an answer from Daniel Miller, an Nmap developer (https://twitter.com/bonsaiviking/status/1461489530264031241):
I was surprised to see there’s not a section on this in the Nmap book. Short answer: it’s optimized to perform traceroute on many targets in parallel without duplicating work. Full info in this source comment:
https://github.com/nmap/nmap/blob/07811b8006021083bbf146ba8f23593e61aef613/traceroute.cc#L62-L100
Wow, that’s fascinating! Thank you again!