Tag Archives: grep

Stats from Participating the NTP Pool Project

I am participating in the NTP Pool Project with at least one NTP server at a time. Of course, I am monitoring the count of NTP clients that are accessing my servers with some RRDtool graphs. ;) I was totally surprised that I got quite high peaks for a couple of minutes whenever one of the servers was in the DNS while the overall rate did grow really slowly. I am still not quite sure why this is the case.

For one month I also logged all source IP addresses to gain some more details about its usage. Let’s have a look at some stats:

Continue reading Stats from Participating the NTP Pool Project

Monitoring a GPS NTP Server

Beyond monitoring Linux OS and basic NTP statistics of your stratum 1 GPS NTP server, you can get some more values from the GPS receiver itself, namely the number of satellites (active & in view) as well as the GPS fix and dilution of precision aka DOP. This brings a few more graphs and details. Nice. Let’s go:

Continue reading Monitoring a GPS NTP Server

Monitoring a DCF77 NTP Server

Now that you’re monitoring the Linux operating system as well as the NTP server basics, it’s interesting to have a look at some more details about the DCF77 receiver. Honestly, there is only one more variable that gives a few details, namely the Clock Status Word and its Event Field. At least you have one more graph in your monitoring system. ;)

Continue reading Monitoring a DCF77 NTP Server

Counting NTP Clients

Wherever you’re running an NTP server: It is really interesting to see how many clients are using it. Either at home, in your company or worldwide at the NTP Pool Project. The problem is that ntp itself does not give you this answer of how many clients it serves. There are the “monstats” and “mrulist” queries but they are not reliable at all since they are not made for this. Hence I had to take another path in order to count NTP clients for my stratum 1 NTP servers. Let’s dig in:

Continue reading Counting NTP Clients

Basic NTP Server Monitoring

Now that you have your own NTP servers up and running (such as some Raspberry Pis with external DCF77 or GPS times sources) you should monitor them appropriately, that is: at least their offset, jitter, and reach. From an operational/security perspective, it is always good to have some historical graphs that show how any service behaves under normal circumstances to easily get an idea about a problem in case one occurs. With this post I am showing how to monitor your NTP servers for offset, jitter, reach, and traffic aka “NTP packets sent/received”.

Continue reading Basic NTP Server Monitoring

Logfile Parsing

While parsing logfiles on a Linux machine, several commands are useful in order to get the appropriate results, e.g., searching for concrete events in firewall logs.

In this post, I list a few standard parsing commands such as grep, sort, uniq, or wc. Furthermore, I present a few examples of these small tools. However, it’s all about try and error when building large command pipes. ;)

Continue reading Logfile Parsing

Grep Commands for Cisco ASA Syslog Messages

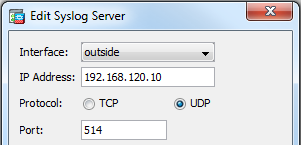
In a basic environment with a Cisco ASA firewall I am logging everything to a syslog-ng server. As there aren’t any reporting tools installed, I am using grep to filter the huge amount of syslog messages in order to get the information I want to know. In this blog post I list a few greps for getting the interesting data.

Continue reading Grep Commands for Cisco ASA Syslog Messages