
I just want to share my happiness about the RIPE Atlas measurements. If you have not heard about it yet, keep on reading. Following is a very basic overview of how the Atlas tool from the RIPE NCC can be used to test the connectivity of your own equipment.
I am hosting a RIPE Atlas Probe (Probe #19341). I am earning credits for the uptime of my hosted probe. Therefore I am able to do some user-defined measurements through other probes worldwide, such as ping, traceroute, or DNS. These measurements are configured through the GUI on the RIPE Atlas webpage. (Unluckily, the GUI is not very intuitive and has some errors. Similarly, the measurements are not always correct by default, e.g., when testing IPv6 equipment, more info here. However, over time you will learn how to use it correctly.) For more information about the Atlas program, refer to the “What is RIPE Atlas?” page. If you want to get your own probe, click here.

Ping ‘n Traceroute
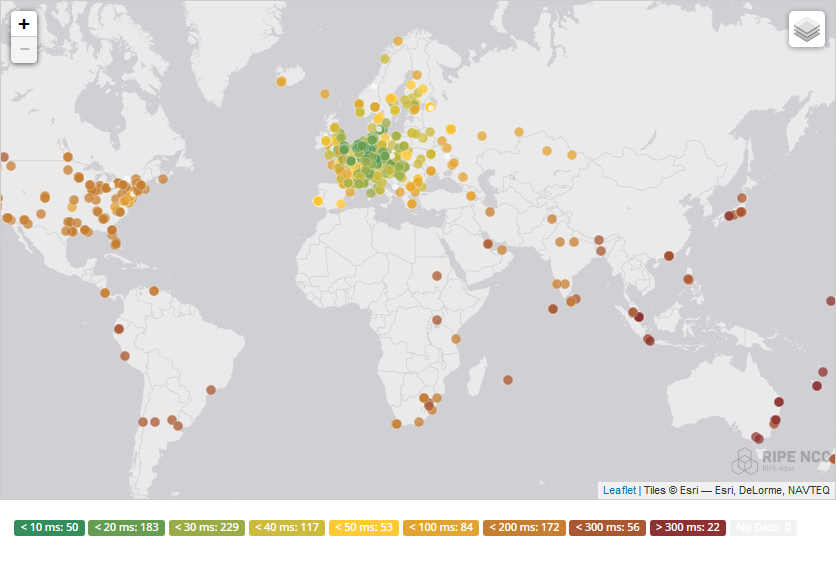
Here are two sample graphs that were generated after I did a one-off measurement with traceroute to my blog at https://weberblog.net over IPv6 and legacy IP. (Refer to User-Defined Measurements.) The following worldwide graphs show the round-trip time (RTT) for these measurements:

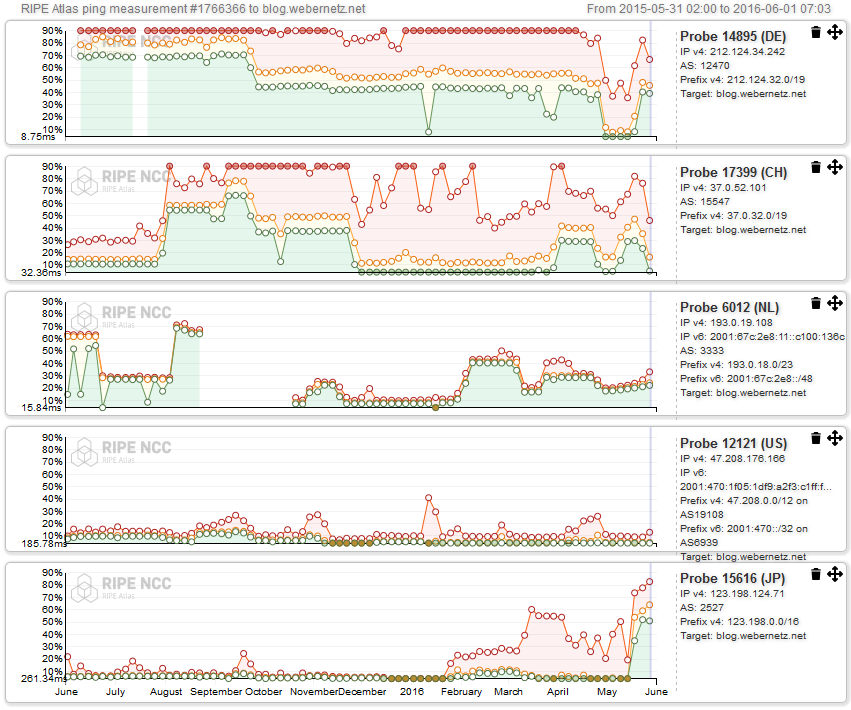
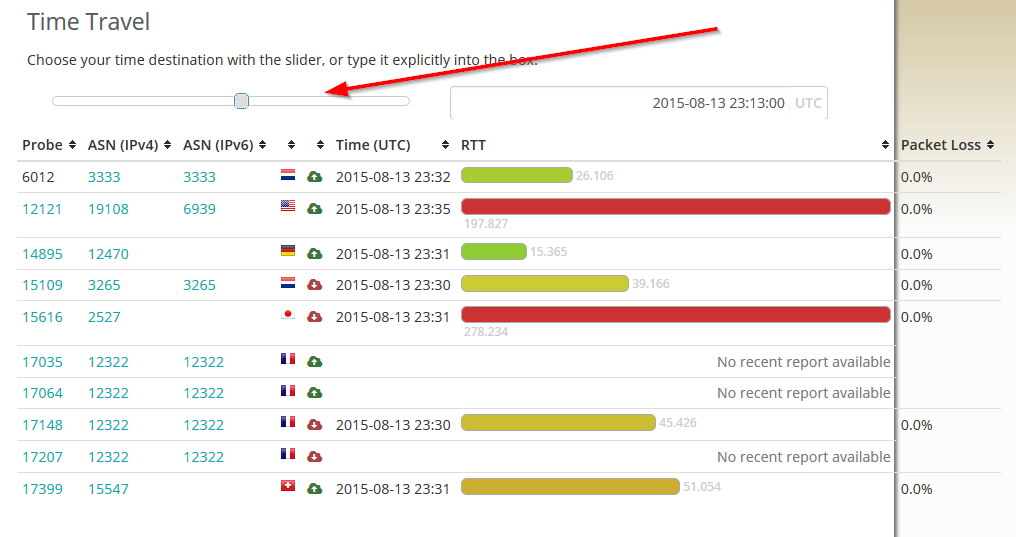
The LatencyMON tab shows the ping times over time. In the following example, I am doing a ping measurement every 10 minutes to weberblog.net again. The first graph shows the times for the whole last year, while the second screenshot shows the Time Travel functionality where I can travel back to every single measurement:
DomainMON
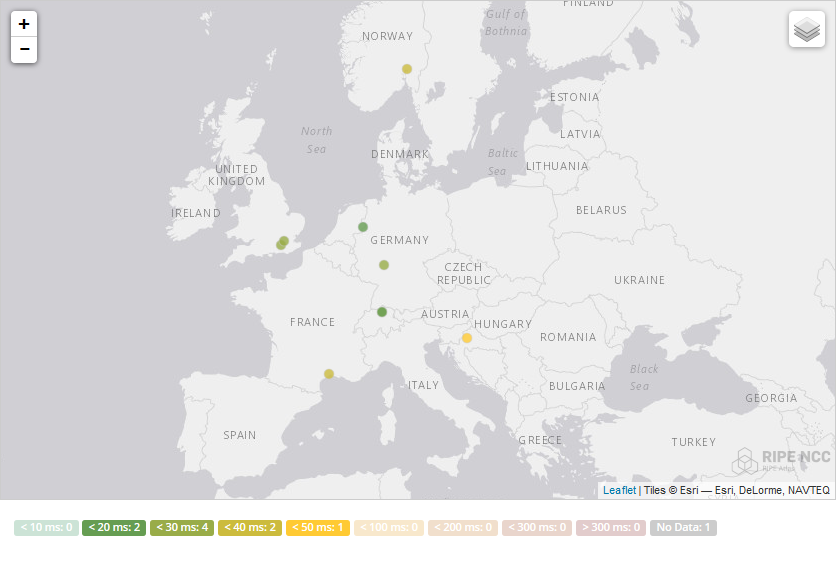
Another tool is the DomainMon. (More information here.) After entering a domain, the nameservers (IPv6 and IPv4) can be monitored with either UDP53, TCP53, or traceroute. I am monitoring my nameservers for my test domain “weberdns.de” with UDP53 every 3600 seconds from 10 probe in the “north-central” area, i.e., Europe. This is the graph over the last 24 hours:

Of course, the other outputs such as the map or the details of probes can be displayed for this DomainMON test, too:

JSON, API, etc.
These GUI tests and graphs are not the only possibility to use the RIPE Atlas. For example, the raw measurement results can be downloaded in JSON to use them within other tools. Or the RIPE Atlas API can be used to execute tests from a command line. Or have a look at the ripe-atlas-tools. (Article: Using RIPE Atlas to Debug Network Connectivity Problems.) However, for one-time measurements, the GUI fits quite good.

Public
Note that the test results are almost public. Each test has an unique measurement ID and the results can be seen by any web browser, such as this one from myself: https://atlas.ripe.net/measurements/3901260/ .
So be carefully in choosing the test machines. However, if only already public DMZ servers are tested, they are accessible through the Internet anyway.
Conclusion
To my mind, the RIPE Atlas program is a great tool to test the IP connectivity of own servers, either as a one-off measurement or over long time range. Furthermore, if a customer wishes to know his own reachability, RIPE Atlas can be used, too. Great.
Featured image “Low Pressure” by Paul Sableman is licensed under CC BY 2.0.
Thank you for the post!
If readers of this blog would like to apply for their own RIPE Atlas probe, here is the unique link:
https://atlas.ripe.net/campaigns/8a5cceb1-bf51-49b6-a72b-a005a05dcafe/