
What’s the first step in a networker’s life if he wants to work with an unknown protocol: he captures and wiresharks it. ;) Following is a downloadable pcap in which I am showing the most common NTP packets such as basic client-server messages, as well as control and authenticated packets. I am also showing how to analyze the delta time with Wireshark, that is: how long an NTP server needs to respond to a request.
As always in my “packet capture” blogposts you are invited to download the following pcap (zipped, 16 KB) and to open it with Wireshark to have a look at it by yourself:
![]()
This file consists of many different NTP packet types. Hence I am using display filters within Wireshark to have a look at specific scenarios. The standard UDP destination port for NTP is 123, while the source port *might* be 123 as well.

Have a look at the current NTPv4 RFC 5905 “Network Time Protocol Version 4: Protocol and Algorithms Specification” in order to understand the packets and protocol details. Looking on the wire you should understand the packet header (section 7.3 in the RFC). Note that I am NOT explaining the NTP algorithm at all, but only the packets and their fields that are present on the network. The most important fields are:
- leap indicator: “2-bit integer warning of an impending leap second to be inserted or deleted in the last minute of the current month […].”
- version: “3-bit integer representing the NTP version number, currently 4.”
- mode: The most common modes are client (3) and server (4). This is the basic client-server unicast request which you’ll see all over your network. Other modes are “symmetric active” (2) between NTP peers and “NTP control message” (6) for controlling/polling NTP servers.
- stratum: The stratum value gives the distance to the reference clock. While the reference clock (if one is used) internally has a stratum value of 0, the NTP server that syncs to that clock has a stratum value of 1. That is: When a server replies with stratum 1, it is directly connected to a reference clock. An NTP server that receives its time from a stratum 1 server increases the value by 1, that is: 2. ;) You won’t see values greater than 4 on the Internet that often. Supported are values up to 15, while 16 means unsynchronized.
- reference ID: “32-bit code identifying the particular server or reference clock.” For stratum 1 servers this is an ASCII string telling you the reference clock such as GPS, PPS or DCFa/DCFp. Above stratum 1 this is either the IPv4 address of the reference NTP server or for IPv6 “it is the first four octets of the MD5 hash of the IPv6 address.” <- D’oh! This looks quite strange. ;( Since I am merely using IPv6 for this NTP blog post series you’ll always see these curious-looking “refid” values in the ntpq output.
- transmit timestamp: “Time at the server when the response left for the client.” This is the most interesting timestamp in those NTP packets since it shows the time the NTP client/server had as it sent the NTP packet. If you roughly want to know the time by looking at an NTP packet, look at this transmit timestamp.
- key ID & MAC: Only present when you’re using NTP authentication. The key ID is the number of the key while the MAC is the message digest (currently MD5 or SHA-1, not to be confused with the Ethernet MAC address).
These variables are seen on the wire for NTP packets. Note that on any NTP server or client you have a couple of columns that are listed in many documentation and are NOT part of the packets but of calculations by the NTP algorithms. Those are when, poll, reach, delay, offset, and jitter. Have a look at the blogpost from Aaron Toponce “Real Life NTP” in which he describes these columns of ntpq (among other things). Or, of course, at the official ntpq documentation.
Basic Client-Server
In my pcap, udp.stream eq 21 shows a basic client to server communication. An NTP client asks a server for the time. In the answer of the server, you can see its stratum (1) and reference clock (DCFa). Normally an NTP communication is ongoing over the lifetime of the ntp service running; it queries the server at the “poll” interval. You can see this behaviour in udp.stream eq 2 where my NTP server asks (as a client) another NTP server on the Internet. The polling interval, in this case, was 64 seconds, the stratum of the server was 2, while the reference ID shows the IPv4 address (or the first bytes of the MD5 hash of the IPv6 address) of the reference from the queried NTP server.


Symmetric Active
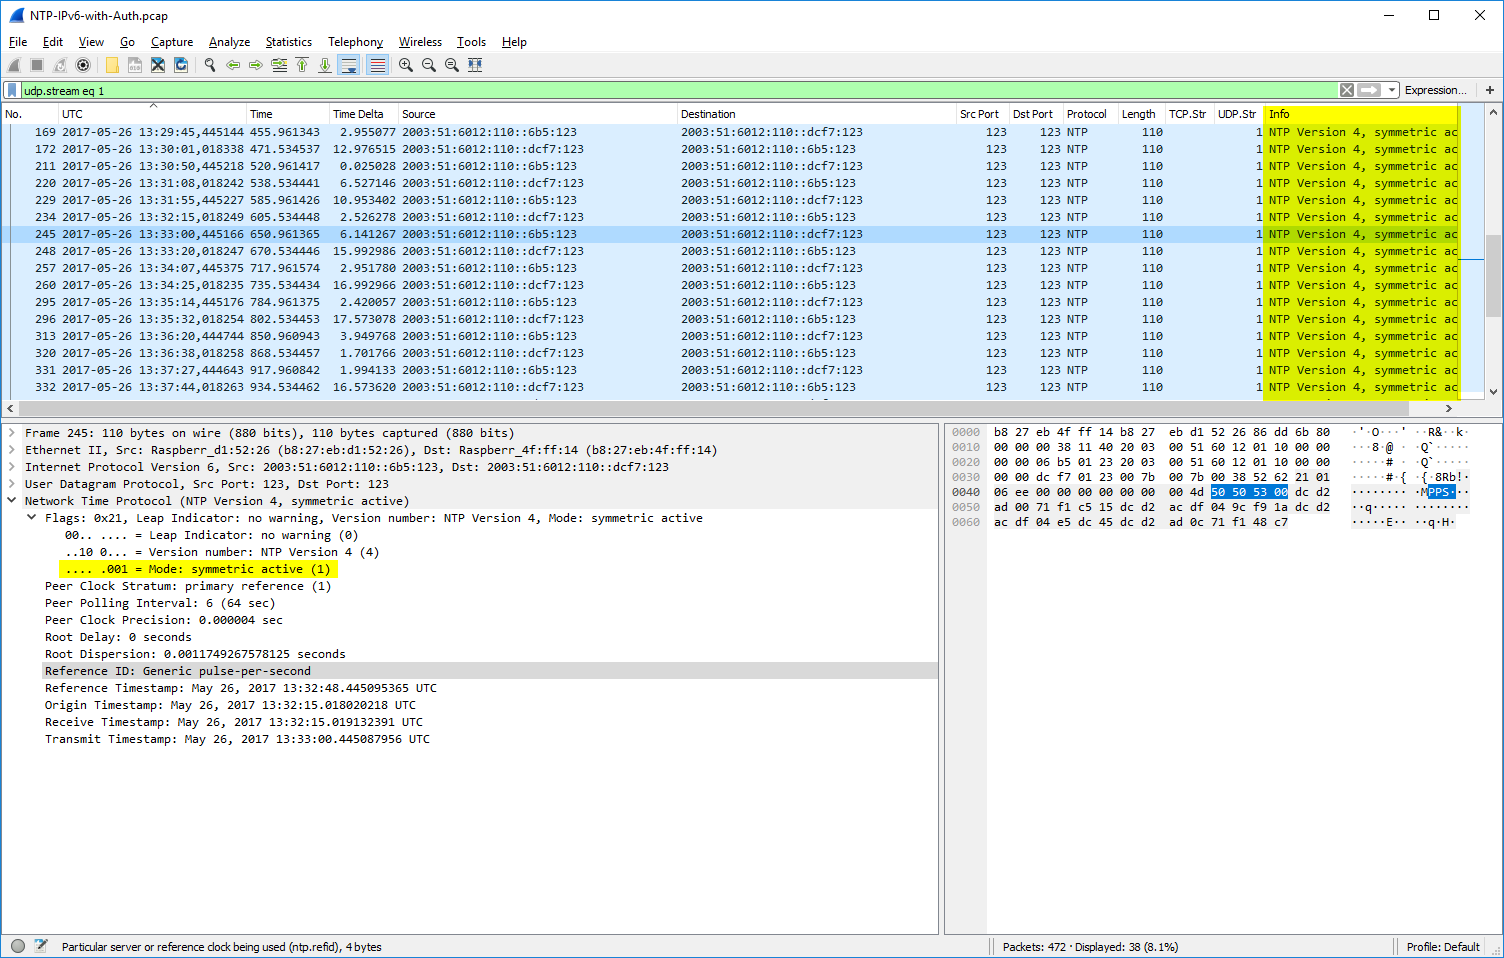
When you’re running multiple NTP servers connected as “peers” rather than “server” (refer to the ntp.conf manpage) in order to sync their clocks against each other, you’ll see symmetric active (mode 1) packets on the wire. udp.stream eq 1 shows the peering between two of my stratum 1 NTP servers.
Control
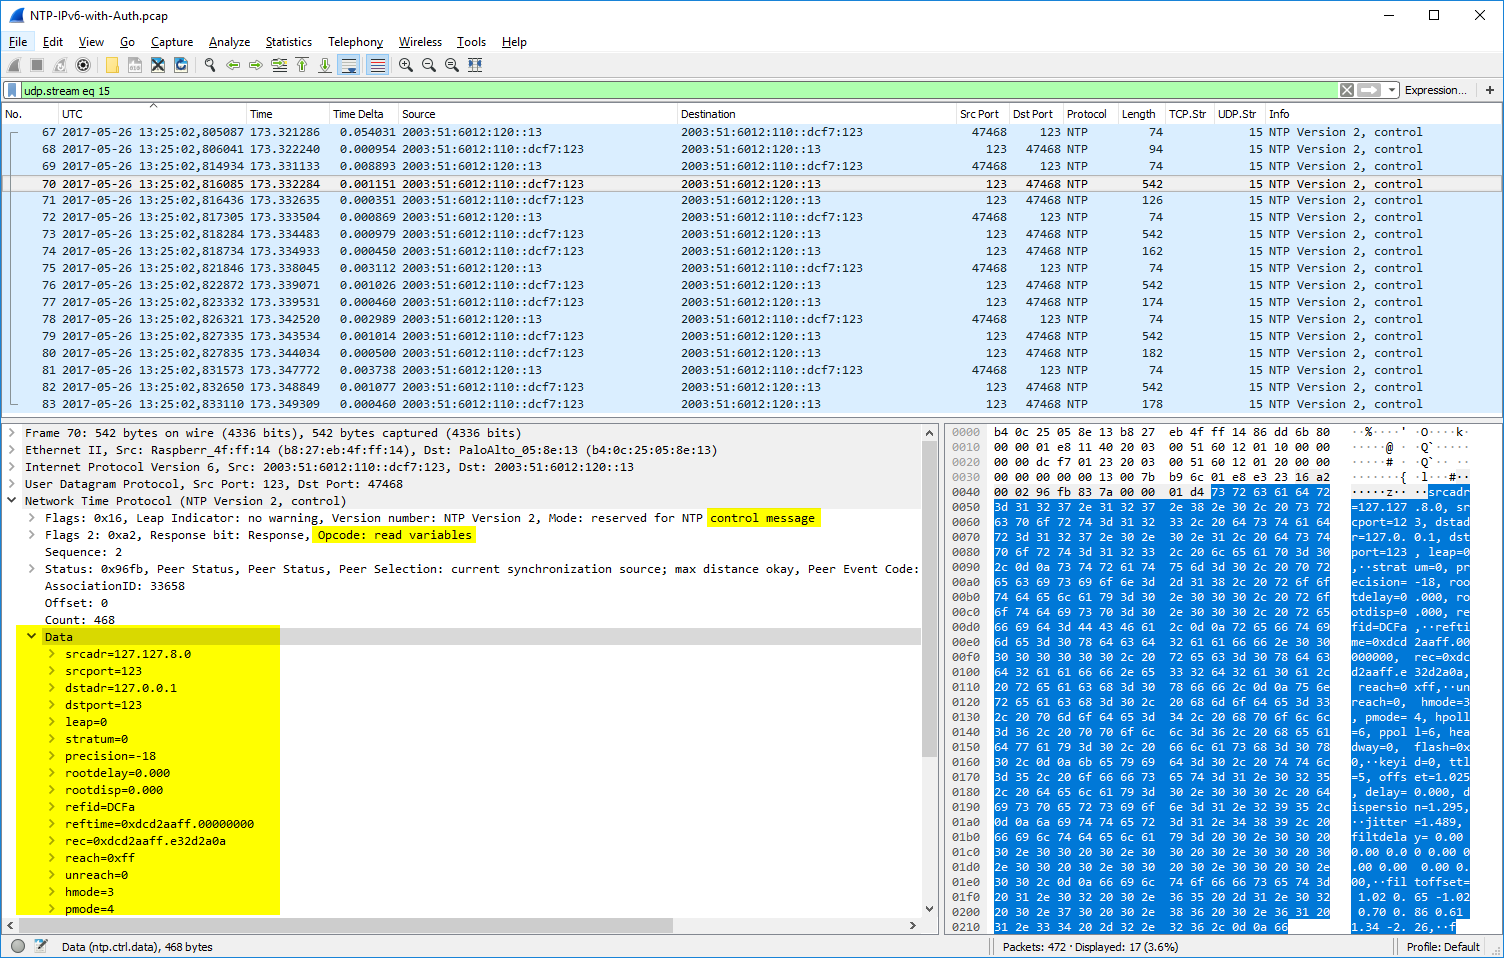
You can send control packets to NTP servers for setting and getting specific information. I am using queries via ntpq from my monitoring server to poll some stats from the NTP servers. (Details are covered in an upcoming blog post.) An example is udp.stream eq 15 in which my monitoring server polled the peers from the NTP server via “ntpq -p ntp1.weberlab.de”. All active connections were sent back to this monitoring server, one by one. Hence a couple of NTP packets within a few milliseconds.

Authentication: MD5, SHA-1, & NAK
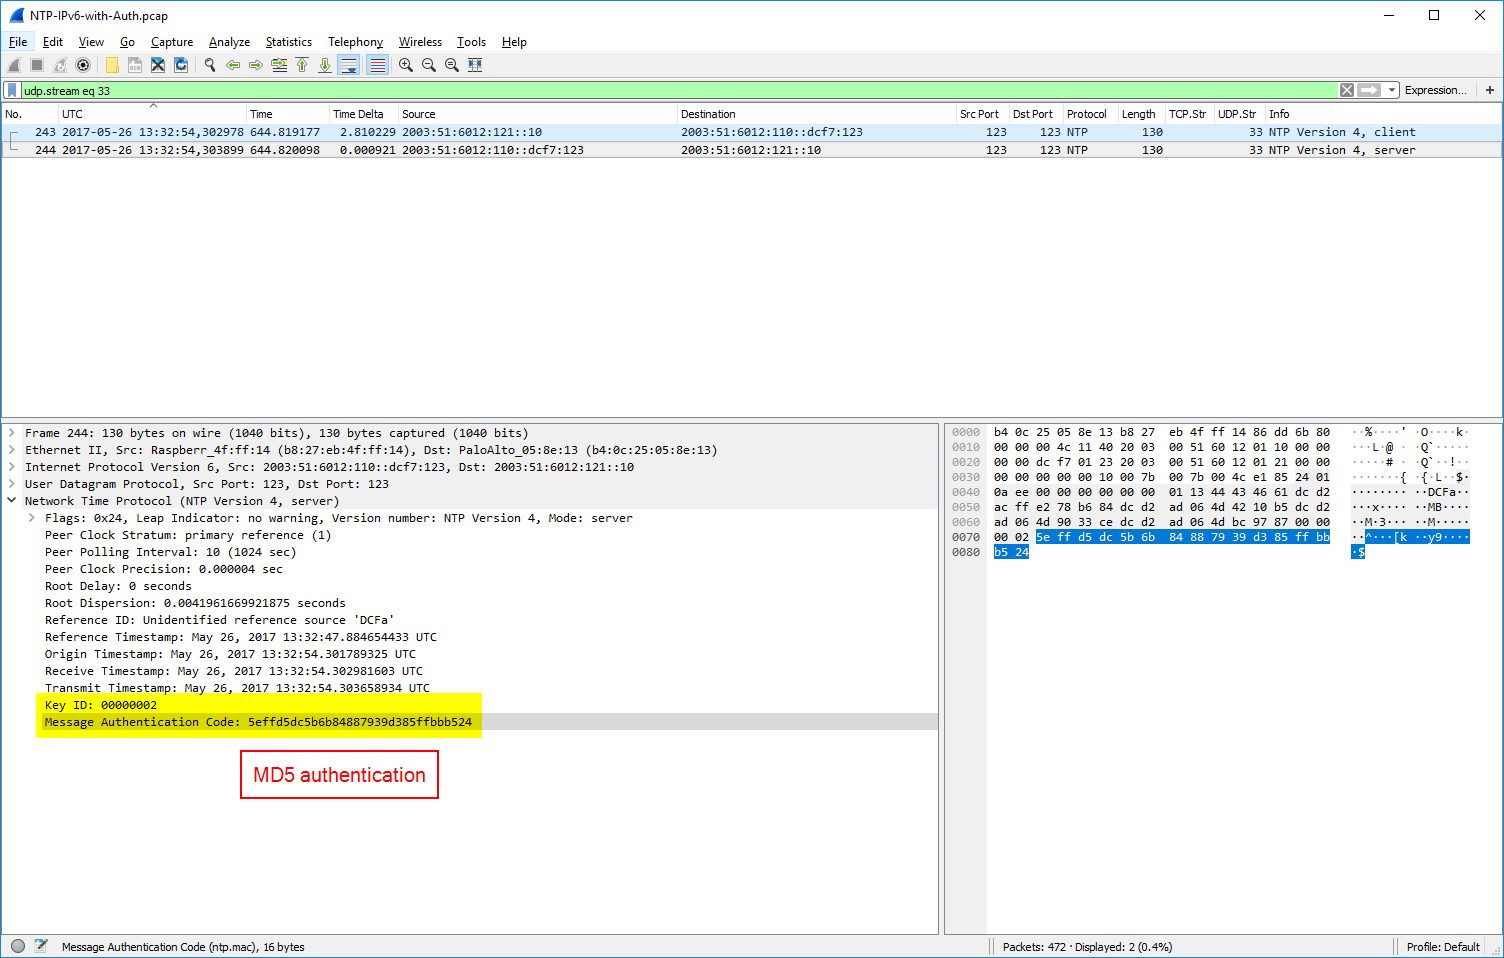
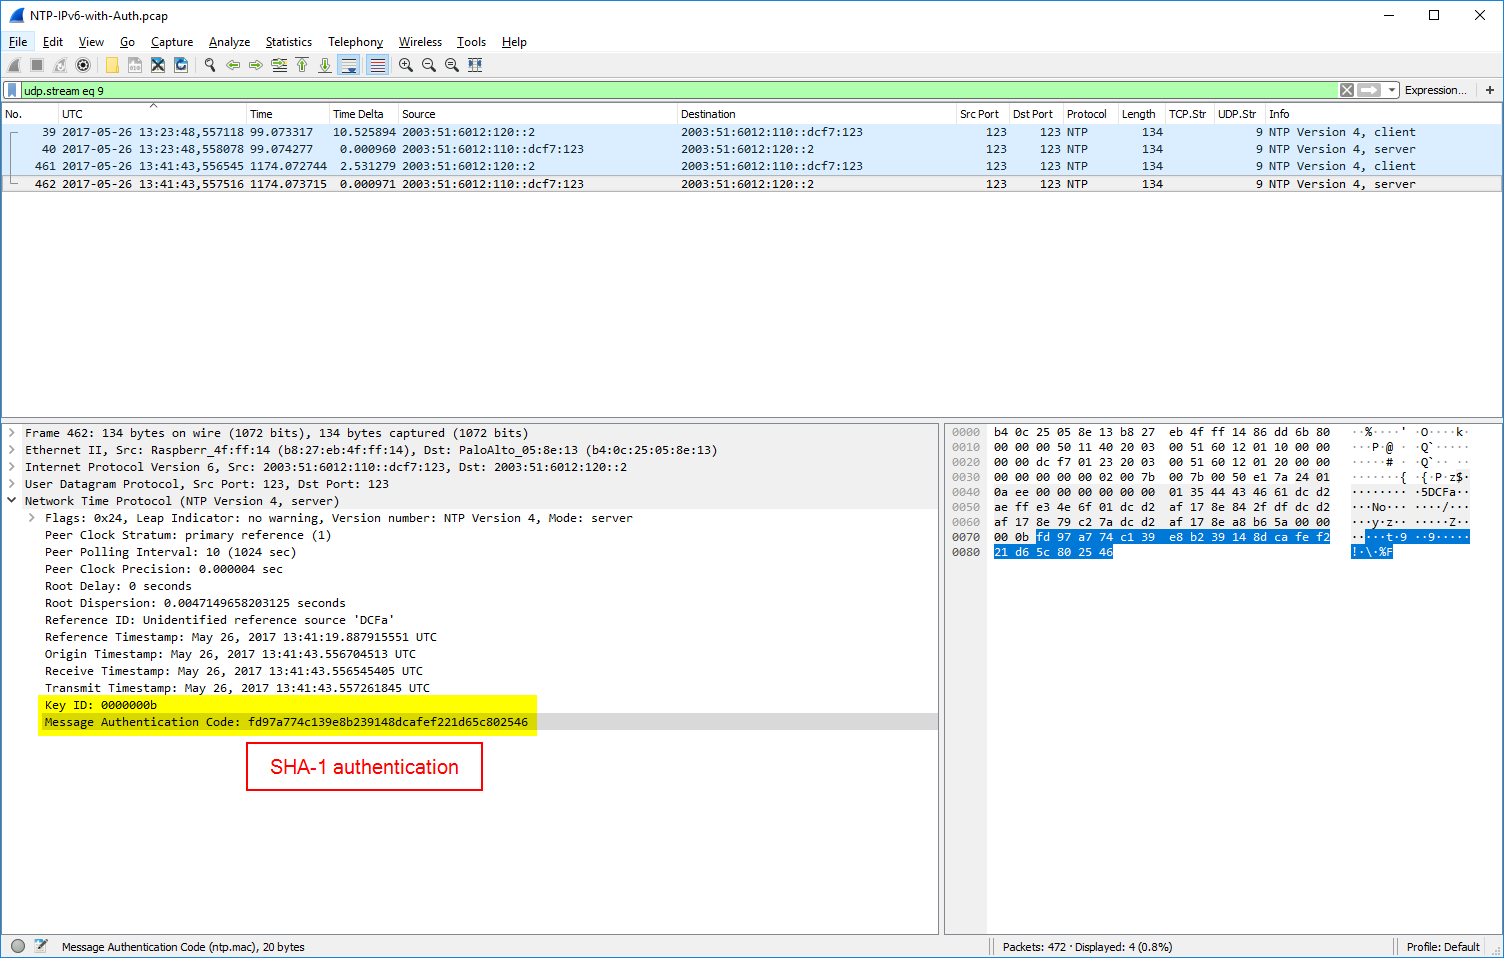
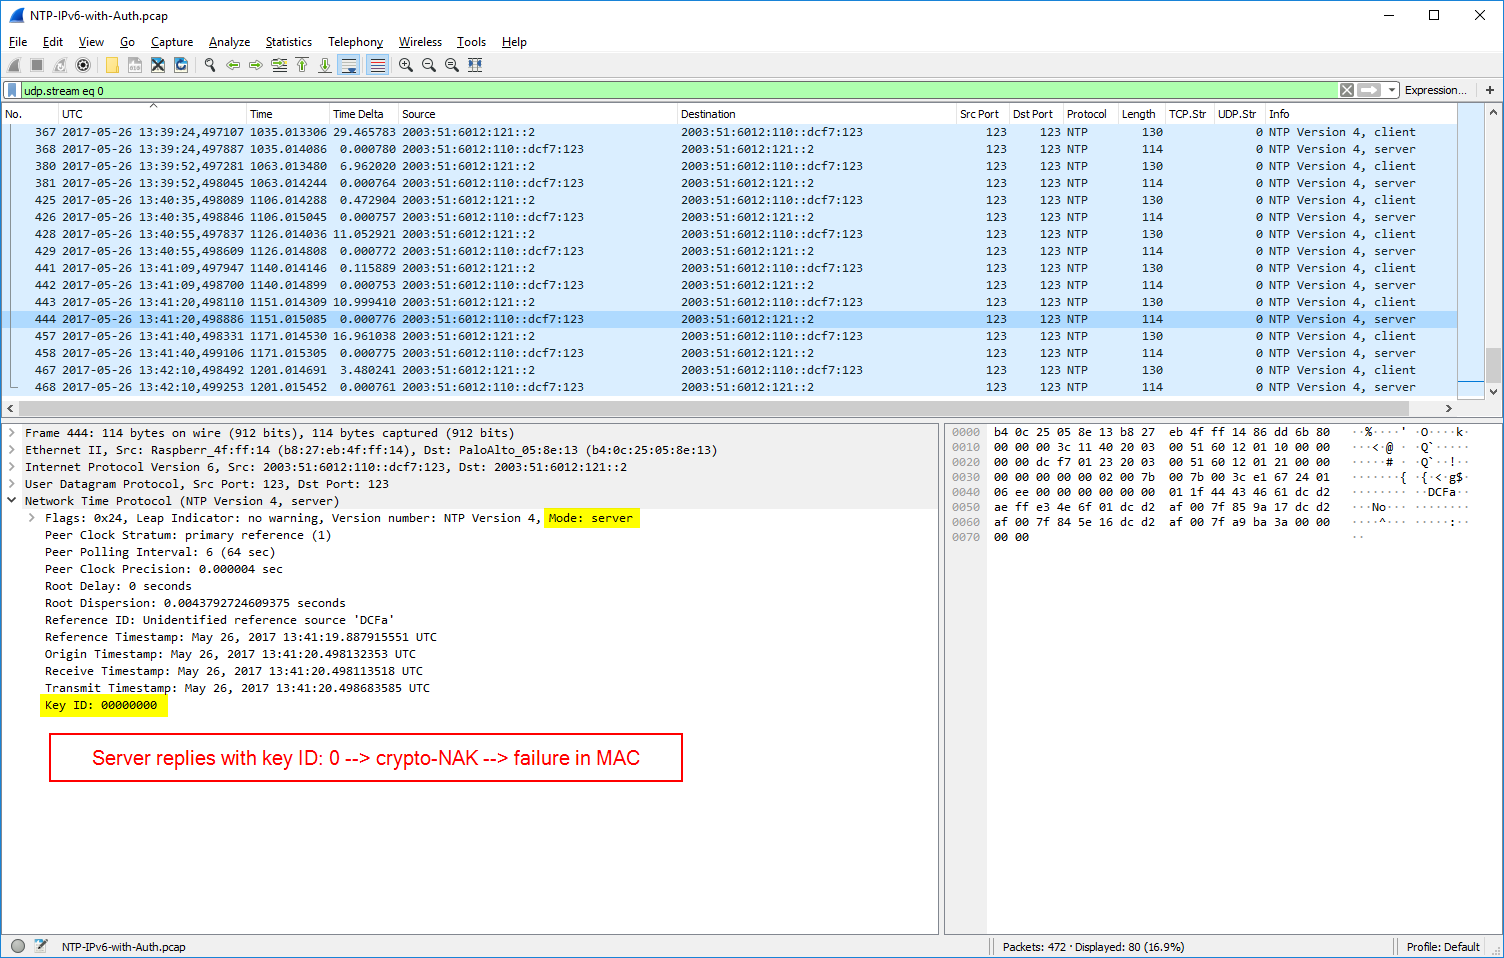
For NTP authentication there are two extension fields added to the packets: the key ID and the message authentication code MAC. (I am covering NTP authentication in a couple of other posts in detail as well.) Depending on the authentication method, MD5 or SHA-1, the length of the MAC differs. udp.stream eq 33 shows an MD5 authentication, udp.stream eq 9 a SHA-1, and udp.stream eq 0 a failure in the authentication, namely a crypto-NAK. Refer to RFC 7822 (Network Time Protocol Version 4 (NTPv4) Extension Fields): “If a MAC is used, it resides at the end of the packet. This field can be either 24 octets long, 20 octets long, or a 4-octet crypto-NAK.”
NTP Delta Time
Due to my Wireshark bug report aka feature request “NTP Analysis: Delta time between Client-Server“, one of the core developers, Pascal Quantin, added the field ntp.delta_time in which Wireshark calculates the time between the client’s request and the corresponding server’s response (similar to the dns.time or http.time fields). You can see this calculated value in square brackets [as always for Wireshark-added fields]. Additionally, I have added a column in my Wireshark GUI to show these values, as you can see in this screenshot for udp.stream eq 2:

Furthermore, you can use the “IO Graphs” from Wireshark to display the ntp.delta_time for certain connections. In the following graph you can see the analysis of udp.stream eq 2 again, while the Y-axis shows the ntp.delta_time field. Since this particular NTP client sent an NTP request every 64 seconds, you can see those ticks in the graph, as well as one spike near 1040 seconds of the trace:

Yeah, that’s it for now. Have a look at your own network and verify the kinds of used NTP versions/servers/stratums/reference clocks/delta_times and so on. ;)
Featured image “Great White Shark” by Elias Levy is licensed under CC BY 2.0.
What would be the request data for NTP in JMeter? Please clarify.
What is JMeter? Please clarify.
in your 1st picture example (highlight above) which one is the SERVER last sync it clock? Transit time in the returning packet from Server to Client?
Next, When did the CLIENT last sync its clock before the synchonization with the Server?
Hello d33r. I am not quite sure I understand your question correctly.
1st: “Reference Timestamp: Time when the system clock was last set or corrected, in NTP timestamp format.”, https://tools.ietf.org/html/rfc5905#section-7.3
2nd: Yes, you’re correct. “Transmit Timestamp (xmt): Time at the server when the response left for the client, in NTP timestamp format.”, https://tools.ietf.org/html/rfc5905#section-7.3
3rd: Uh, good question. That should be the Reference Timestamp (in the client packet, such as #129 in my trace) again.
Hello, Thank you for your explanation.
I was wondering what you thought of the timestamps marked on the requests from udp.stream eq 19. Why are they NULL? can you give an insight on what type of device you are using for them as well? I am getting sismilar traffic and was curious about your opinion.
Thank you!
Hey Basma,
thanks for your question. To my mind this is normal NTP behaviour when the client first starts the NTP process and does not have any time at all. Referencing RFC 5905 section 8, https://tools.ietf.org/html/rfc5905#section-8, “the first packet transmitted by A contains only the origin timestamp”. While the origin timestamp, section 7.3, is “Time at the client when the request departed for the server, in NTP timestamp format.”
However, if the client does not have a time at all (which happens quite often with IoT devices without any real-time clock RTC at all), it’s probably set to NULL rather than to some random value.
The client in
udp.stream eq 19is unknown to me. I simply picked some random client which requested one of my NTP servers. ;)Cheers
Johannes