I constructed a MRTG/Routers2 configuration template for the Cisco ASA firewall which consists the OIDs (graphs) for the interfaces, CPU, memory, VPNs, connections, ping times, and traceroute hop counts. With only four search-and-replace changes as well as a few further specifications, the whole SNMP monitoring for that firewall is configured.
With this template, the following graphs are shown:
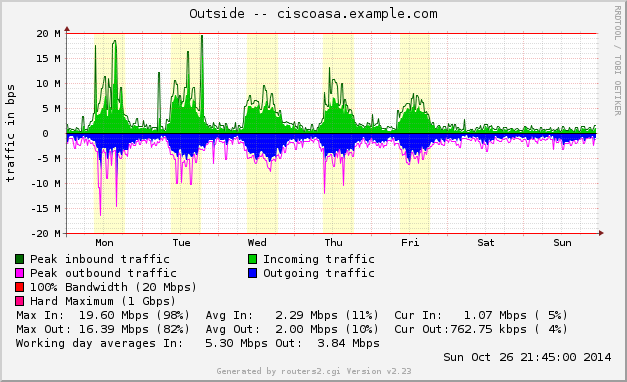
- Interfaces
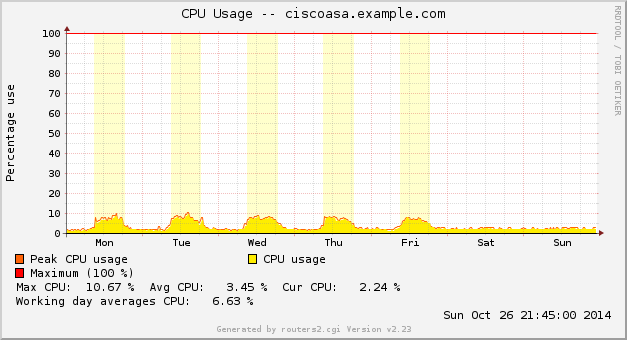
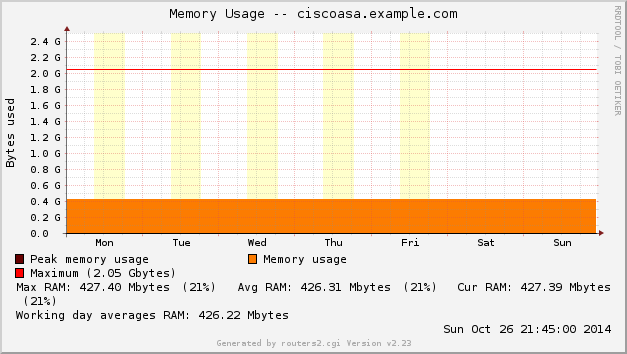
- CPU & Memory
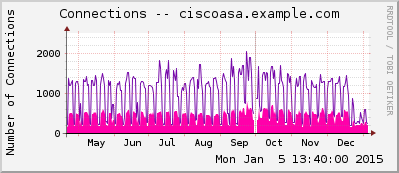
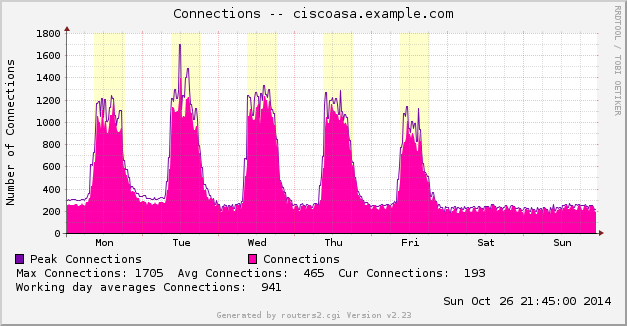
- Connections
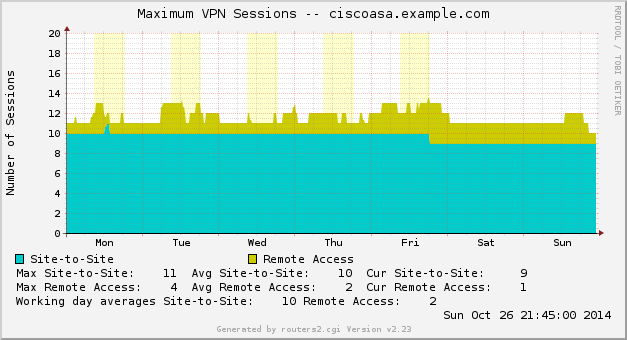
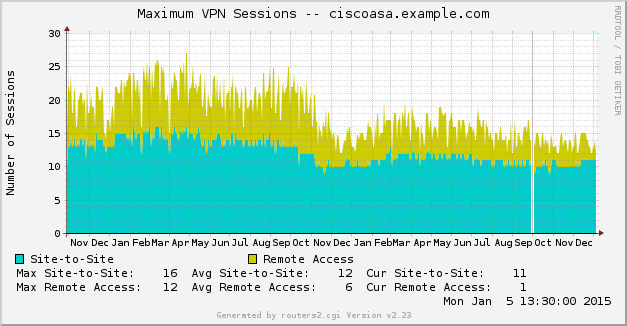
- VPN Sessions (RA & S2S total count)
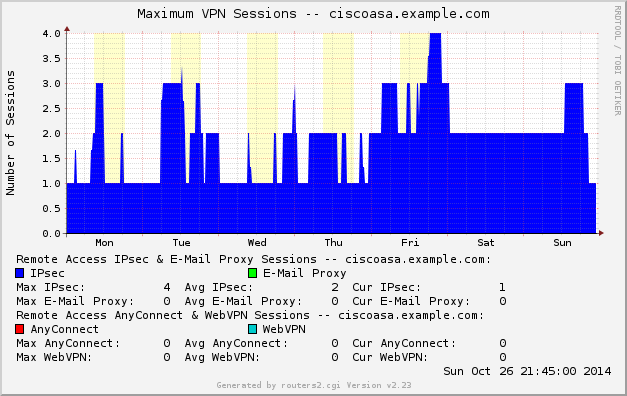
- VPN Remote Access Sessions (IPsec, AnyConnect, WebVPN)
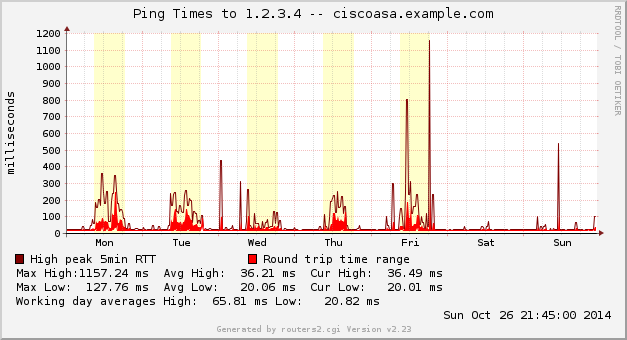
- Ping Outside IP (mrtg-ping-probe script covered here)
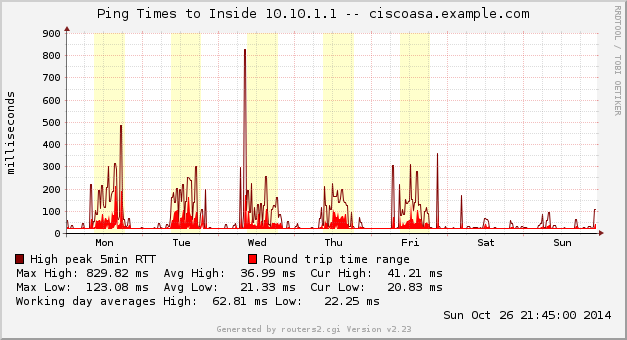
- Ping Inside IP through VPN-Tunnel (if available)
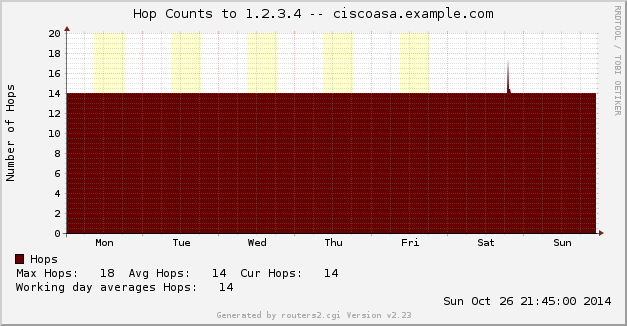
- Hop Count to Outside IP (with my script from here)
- Short Summary (only: CPU, connections, VPN, outside interface, ping outside)
Download the Template
This is the *.cfg template file. Follow the first comment lines in the file to replace the correct values inside the template.
|
1 2 3 4 5 6 7 8 9 10 11 12 13 14 15 16 17 18 19 20 21 22 23 24 25 26 27 28 29 30 31 32 33 34 35 36 37 38 39 40 41 42 43 44 45 46 47 48 49 50 51 52 53 54 55 56 57 58 59 60 61 62 63 64 65 66 67 68 69 70 71 72 73 74 75 76 77 78 79 80 81 82 83 84 85 86 87 88 89 90 91 92 93 94 95 96 97 98 99 100 101 102 103 104 105 106 107 108 109 110 111 112 113 114 115 116 117 118 119 120 121 122 123 124 125 126 127 128 129 130 131 132 133 134 135 136 137 138 139 140 141 142 143 144 145 146 147 148 149 150 151 152 153 154 155 156 157 158 159 160 161 162 163 164 165 166 167 168 169 170 171 172 173 174 175 176 177 178 179 180 181 182 183 184 185 186 187 188 189 190 191 192 193 194 195 196 197 198 199 200 201 202 203 204 205 206 207 208 209 210 211 212 213 214 215 216 217 218 219 220 221 222 223 224 225 226 227 228 229 230 231 232 233 234 235 236 237 238 239 240 241 242 243 244 245 246 247 248 249 250 251 252 253 254 255 256 257 258 259 260 261 262 263 264 265 266 267 268 269 270 271 272 273 274 275 276 277 278 279 280 281 282 283 284 285 286 287 288 289 290 291 292 293 294 295 296 297 298 299 300 301 302 303 304 305 306 307 308 309 310 311 312 313 314 315 316 317 318 319 320 321 322 323 324 325 |
################################################################################################################ #Cisco ASA Firewall MRTG/Routers2 Template #Author: Johannes Weber (johannes@webernetz.net) #Homepage: https://weberblog.net #Last Modified: 2014-01-13 ################################################################################################################ #NOTE: For the "Traceroute Hop Count to Outside" part, my traceroute2mrtg script is mandatory! #You can download it here: http://weberblog.net/mrtgrouters2-counting-traceroute-hops/ #Per default, this section is disabled (commented out). If you want to use it, remove the comments (#). #The following Cisco command shows all OIDs that the device provides: show snmp-server oidlist #All interfaces use ifHCInOctets and ifHCOutOctets from the ifMIB 1.3.6.1.2.1.31 #If this does not work, the noHC[]=yes option must be set #Backround: the HC is a Counter64 which is better than the old Counter32 because it does not overflow that fast #If using this cfg file, the following things must be changed: # #value in this file #new value #------------------------------------------------------------- #10.10.1.1 #new IPv4 address of the inside (and management) interface #FIREWALLNAME #new name of the device #abcdEFGH #new SNMP community string #1.2.3.4 #new IPv4 address of the outside interface #!Specify the amount of MBytes of RAM #!Specify interfaces manually just like the Outside/Inside/DMZ interfaces beneath #!Uncomment the traceroute2mrtg section if you want to use these statistics, too #Icon for Office Firewall: routers.cgi*Icon: firewall3-sm.gif #Icon for Home-Office Firewall: #routers.cgi*Icon: user-sm.gif ################################################################################################################ ##################################################### CPU ###################################################### ################################################################################################################ #Used MIB: CISCO-PROCESS-MIB #CPU usage on a 5-min avarage basis, which is the most accurate #http://www.cisco.com/en/US/tech/tk648/tk362/technologies_tech_note09186a0080094a94.shtml Target[10.10.1.1_cpu]: 1.3.6.1.4.1.9.9.109.1.1.1.1.5.1&PseudoZero:abcdEFGH@10.10.1.1:::::2 Title[10.10.1.1_cpu]: CPU Usage -- FIREWALLNAME MaxBytes[10.10.1.1_cpu]: 100 Options[10.10.1.1_cpu]: gauge Colours[10.10.1.1_cpu]: LIGHT YELLOW#FEED01, BLUE#0000FF, ORANGE#FF6307, VIOLET#FF00FF UnScaled[10.10.1.1_cpu]: dwmy LegendI[10.10.1.1_cpu]: CPU: routers.cgi*Mode[10.10.1.1_cpu]: cpu routers.cgi*ShortDesc[10.10.1.1_cpu]: CPU routers.cgi*InSummary[10.10.1.1_cpu]: yes routers.cgi*Summary[10.10.1.1_cpu]: 10.10.1.1_shortsummary ################################################################################################################ ################################################### Memory ##################################################### ################################################################################################################ #Used MIB: CISCO-MEMORY-POOL-MIB Target[10.10.1.1_mem]: 1.3.6.1.4.1.9.9.48.1.1.1.5.1&PseudoZero:abcdEFGH@10.10.1.1:::::2 Title[10.10.1.1_mem]: Memory Usage -- FIREWALLNAME #In this example: 2 GB MaxBytes[10.10.1.1_mem]: 2048000000 Options[10.10.1.1_mem]: gauge Colours[10.10.1.1_mem]: ORANGE#FC7C01, GREEN#00CC00, DARK RED#660000, DARK GREEN#006600 UnScaled[10.10.1.1_mem]: dwmy LegendI[10.10.1.1_mem]: RAM: routers.cgi*Options[10.10.1.1_mem]: noo routers.cgi*ShortDesc[10.10.1.1_mem]: Memory routers.cgi*InSummary[10.10.1.1_mem]: yes #routers.cgi*Summary[10.10.1.1_mem]: 10.10.1.1_shortsummary ################################################################################################################ ################################################## Connections ################################################# ################################################################################################################ #There is currently no MIB the provides the "show xlate count" value (November 2012) #Used MIB Connections: CISCO-UNIFIED-FIREWALL-MIB Target[10.10.1.1_connectionsxlates]: 1.3.6.1.4.1.9.9.491.1.1.1.6.0&PseudoZero:abcdEFGH@10.10.1.1:::::2 Title[10.10.1.1_connectionsxlates]: Connections -- FIREWALLNAME #MaxBytes is set to an unrealistic high value. This has no effect because there is no percent calculation. MaxBytes[10.10.1.1_connectionsxlates]: 100000 Options[10.10.1.1_connectionsxlates]: gauge Colours[10.10.1.1_connectionsxlates]: PURPLE#FF00AA, YELLOW#FFD600, DARK PURPLE#7608AA, ORANGE#FC7C01 YLegend[10.10.1.1_connectionsxlates]: Number of Connections Legend1[10.10.1.1_connectionsxlates]: Connections Legend2[10.10.1.1_connectionsxlates]: Xlates Legend3[10.10.1.1_connectionsxlates]: Peak Connections Legend4[10.10.1.1_connectionsxlates]: Peak Xlates LegendI[10.10.1.1_connectionsxlates]: Connections: LegendO[10.10.1.1_connectionsxlates]: Xlates: ShortLegend[10.10.1.1_connectionsxlates]: routers.cgi*Options[10.10.1.1_connectionsxlates]: fixunit integer nomax noo nototal routers.cgi*Icon[10.10.1.1_connectionsxlates]: firewall-sm.gif routers.cgi*ShortDesc[10.10.1.1_connectionsxlates]: Connections routers.cgi*InSummary[10.10.1.1_connectionsxlates]: yes routers.cgi*Summary[10.10.1.1_connectionsxlates]: 10.10.1.1_shortsummary ################################################################################################################ ################################################ Dropped Packets ############################################### ################################################################################################################ #Currently no MIB #show asp drop ################################################################################################################ ################################################# Attack Rates ################################################# ################################################################################################################ #Currently no MIB ################################################################################################################ ################################################# Syslog Events ################################################ ################################################################################################################ #Currently no MIB #Idea: Show all 8 levels of syslog events (severity) to see how many events/failures occur ################################################################################################################ ################################################# VPN Sessions ################################################# ################################################################################################################ #Used MIB: CISCO-REMOTE-ACCESS-MONITOR-MIB #Site-to-Site: 1.3.6.1.4.1.9.9.392.1.3.29.0 #All Remote Access Sessions: 1.3.6.1.4.1.9.9.392.1.3.1.0 #Remote Access IPsec: 1.3.6.1.4.1.9.9.392.1.3.26.0 #Remote Access AnyConnect SVC: 1.3.6.1.4.1.9.9.392.1.3.35.0 #Remote Access WebVPN: 1.3.6.1.4.1.9.9.392.1.3.38.0 #E-Mail Proxy: 1.3.6.1.4.1.9.9.392.1.3.23.0 Target[10.10.1.1_vpn]: 1.3.6.1.4.1.9.9.392.1.3.29.0&1.3.6.1.4.1.9.9.392.1.3.1.0:abcdEFGH@10.10.1.1:::::2 Title[10.10.1.1_vpn]: Maximum VPN Sessions -- FIREWALLNAME MaxBytes[10.10.1.1_vpn]: 1000 Options[10.10.1.1_vpn]: gauge Colours[10.10.1.1_vpn]: TURQUOISE#00CCCC, DARK YELLOW#CCCC00, DARK TURQUOISE#377D77, ORANGE#E97F02 YLegend[10.10.1.1_vpn]: Number of Sessions Legend1[10.10.1.1_vpn]: Site-to-Site Legend2[10.10.1.1_vpn]: Remote Access Legend3[10.10.1.1_vpn]: Peak Site-to-Site Legend4[10.10.1.1_vpn]: Peak Remote Access LegendI[10.10.1.1_vpn]: Site-to-Site: LegendO[10.10.1.1_vpn]: Remote Access: ShortLegend[10.10.1.1_vpn]: #This graph shows the MAXIMUM value and not the Average! routers.cgi*Options[10.10.1.1_vpn]: fixunit integer maximum nomax nototal routers.cgi*GraphStyle[10.10.1.1_vpn]: stack routers.cgi*Icon[10.10.1.1_vpn]: padlock-sm.gif routers.cgi*ShortDesc[10.10.1.1_vpn]: VPN routers.cgi*InSummary[10.10.1.1_vpn]: yes routers.cgi*Summary[10.10.1.1_vpn]: 10.10.1.1_shortsummary #The following two Targets are NOT visible in the Routers2 page since they are only used for the User Graph below Target[10.10.1.1_vpn2]: 1.3.6.1.4.1.9.9.392.1.3.26.0&1.3.6.1.4.1.9.9.392.1.3.23.0:abcdEFGH@10.10.1.1:::::2 Title[10.10.1.1_vpn2]: Remote Access IPsec & E-Mail Proxy Sessions -- FIREWALLNAME MaxBytes[10.10.1.1_vpn2]: 1000 Options[10.10.1.1_vpn2]: gauge YLegend[10.10.1.1_vpn2]: Number of Sessions Legend1[10.10.1.1_vpn2]: IPsec Legend2[10.10.1.1_vpn2]: E-Mail Proxy Legend3[10.10.1.1_vpn2]: Peak IPsec Legend4[10.10.1.1_vpn2]: Peak E-Mail Proxy LegendI[10.10.1.1_vpn2]: IPsec: LegendO[10.10.1.1_vpn2]: E-Mail Proxy: ShortLegend[10.10.1.1_vpn2]: routers.cgi*Options[10.10.1.1_vpn2]: fixunit integer maximum nomax nototal routers.cgi*GraphStyle[10.10.1.1_vpn2]: stack routers.cgi*Icon[10.10.1.1_vpn2]: padlock-sm.gif routers.cgi*ShortDesc[10.10.1.1_vpn2]: VPN RA IPsec & E-Mail routers.cgi*Ignore[10.10.1.1_vpn2]: yes routers.cgi*Graph[10.10.1.1_vpn2]: 10.10.1.1_vpnsummary Target[10.10.1.1_vpn3]: 1.3.6.1.4.1.9.9.392.1.3.35.0&1.3.6.1.4.1.9.9.392.1.3.38.0:abcdEFGH@10.10.1.1:::::2 Title[10.10.1.1_vpn3]: Remote Access AnyConnect & WebVPN Sessions -- FIREWALLNAME MaxBytes[10.10.1.1_vpn3]: 1000 Options[10.10.1.1_vpn3]: gauge YLegend[10.10.1.1_vpn3]: Number of Sessions Legend1[10.10.1.1_vpn3]: AnyConnect Legend2[10.10.1.1_vpn3]: WebVPN Legend3[10.10.1.1_vpn3]: Peak AnyConnect Legend4[10.10.1.1_vpn3]: Peak WebVPN LegendI[10.10.1.1_vpn3]: AnyConnect: LegendO[10.10.1.1_vpn3]: WebVPN: ShortLegend[10.10.1.1_vpn3]: routers.cgi*Options[10.10.1.1_vpn3]: fixunit integer maximum nomax nototal routers.cgi*GraphStyle[10.10.1.1_vpn3]: stack routers.cgi*Icon[10.10.1.1_vpn3]: padlock-sm.gif routers.cgi*ShortDesc[10.10.1.1_vpn3]: VPN RA Any & Web routers.cgi*Ignore[10.10.1.1_vpn3]: yes routers.cgi*Graph[10.10.1.1_vpn3]: 10.10.1.1_vpnsummary ################################################################################################################ #User Graph: shows detailed statistics of the Remote Access VPN sessions: IPsec, Anyconnect, WebVPN, and E-Mail Proxy routers.cgi*Options[10.10.1.1_vpnsummary]: nototal routers.cgi*Title[10.10.1.1_vpnsummary]: Maximum VPN Sessions -- FIREWALLNAME routers.cgi*LegendTI[10.10.1.1_vpnsummary]: VPN Sessions: routers.cgi*ShortDesc[10.10.1.1_vpnsummary]: VPN RA routers.cgi*Icon[10.10.1.1_vpnsummary]: padlock-sm.gif #routers.cgi*Summary[10.10.1.1_vpnsummary]: 10.10.1.1_shortsummary ################################################################################################################ ################################################ IKE/IPsec Stats ############################################### ################################################################################################################ #I tried something about the new IPsec connections per second. But it was not meaningful. #Used MIB: CISCO-IPSEC-FLOW-MONITOR-MIB #Target[10.10.1.1_ikeipsec]: 1.3.6.1.4.1.9.9.171.1.2.1.2.0&1.3.6.1.4.1.9.9.171.1.3.1.2.0:abcdEFGH@10.10.1.1:::::2 #Title[10.10.1.1_ikeipsec]: New IKE/IPsec Tunnels -- FIREWALLNAME #MaxBytes[10.10.1.1_ikeipsec]: 1000 #Colours[10.10.1.1_ikeipsec]: TURQUOISE#00CCCC, DARK YELLOW#CCCC00, DARK TURQUOISE#377D77, ORANGE#E97F02 #YLegend[10.10.1.1_ikeipsec]: per minute #Legend1[10.10.1.1_ikeipsec]: IKE Tunnels #Legend2[10.10.1.1_ikeipsec]: IPsec Tunnels #Legend3[10.10.1.1_ikeipsec]: Peak IKE Tunnels #Legend4[10.10.1.1_ikeipsec]: Peak IPsec Tunnels #LegendI[10.10.1.1_ikeipsec]: IKE: #LegendO[10.10.1.1_ikeipsec]: IPsec: #ShortLegend[10.10.1.1_ikeipsec]: Tun/min #routers.cgi*Options[10.10.1.1_ikeipsec]: fixunit nomax nopercentile perminute #routers.cgi*GraphStyle[10.10.1.1_ikeipsec]: lines #routers.cgi*Icon[10.10.1.1_ikeipsec]: padlock-sm.gif #routers.cgi*ShortDesc[10.10.1.1_ikeipsec]: IKE/IPsec #routers.cgi*InSummary[10.10.1.1_ikeipsec]: no ################################################################################################################ ################################################ Ping outside IP ############################################### ################################################################################################################ #Since mrtg-ping-probe outputs integers, the values are multiplied to have milliseconds reported #i.e., instead of "5" the answer is now "5324" which is interpreted by Factor[] as 5.324 ms Target[10.10.1.1_ping-outside]: `mrtg-ping-probe -p '1000*max/1000*min' -s 1.2.3.4` Title[10.10.1.1_ping-outside]: Ping Times to Outside 1.2.3.4 -- FIREWALLNAME #MaxBytes: 100 ms * 1000 (due to mrtg-ping-probe *1000) MaxBytes[10.10.1.1_ping-outside]: 100000 #AbsMax: 10 seconds AbsMax[10.10.1.1_ping-outside]: 10000000 Options[10.10.1.1_ping-outside]: gauge Factor[10.10.1.1_ping-outside]: 0.001 Colours[10.10.1.1_ping-outside]: RED#FF0000, WHATEVER#123456, DARK RED#800000, WHATEVER2#654321 routers.cgi*ShortName[10.10.1.1_ping-outside]: Ping Outside routers.cgi*Options[10.10.1.1_ping-outside]: fixunit nomax nopercentile nototal routers.cgi*GraphStyle[10.10.1.1_ping-outside]: range routers.cgi*Icon[10.10.1.1_ping-outside]: clock-sm.gif routers.cgi*Summary[10.10.1.1_ping-outside]: 10.10.1.1_shortsummary ################################################################################################################ ######################################### Ping inside IP through VPN Tunnel #################################### ################################################################################################################ #Since mrtg-ping-probe outputs integers, the values are multiplied to have milliseconds reported #i.e., instead of "5" the answer is now "5324" which is interpreted by Factor[] as 5.324 ms Target[10.10.1.1_ping-inside]: `mrtg-ping-probe -p '1000*max/1000*min' -s 10.10.1.1` Title[10.10.1.1_ping-inside]: Ping Times to Inside 10.10.1.1 -- FIREWALLNAME #MaxBytes: 100 ms * 1000 (due to mrtg-ping-probe *1000) MaxBytes[10.10.1.1_ping-inside]: 100000 #AbsMax: 10 seconds AbsMax[10.10.1.1_ping-inside]: 10000000 Options[10.10.1.1_ping-inside]: gauge Factor[10.10.1.1_ping-inside]: 0.001 Colours[10.10.1.1_ping-inside]: RED#FF0000, WHATEVER#123456, DARK RED#800000, WHATEVER2#654321 routers.cgi*ShortName[10.10.1.1_ping-inside]: Ping Inside routers.cgi*Options[10.10.1.1_ping-inside]: fixunit nomax nopercentile nototal routers.cgi*GraphStyle[10.10.1.1_ping-inside]: range routers.cgi*Icon[10.10.1.1_ping-inside]: clock-sm.gif #routers.cgi*Summary[10.10.1.1_ping-inside]: 10.10.1.1_shortsummary ################################################################################################################ ######################################### Traceroute Hop Count to Outside ###################################### ################################################################################################################ #Target[10.10.1.1_traceroute]: `/usr/local/bin/traceroute2mrtg 1.2.3.4` #Title[10.10.1.1_traceroute]: Hop Counts to 1.2.3.4 -- FIREWALLNAME #MaxBytes: Since the standard traceroute command stops after 30 hops, this value fits for the MaxBytes, too. #MaxBytes[10.10.1.1_traceroute]: 30 #Options[10.10.1.1_traceroute]: gauge #Colours[10.10.1.1_traceroute]: BROWN#660000, YELLOW#FFD600, BLACK#000000, ORANGE#FC7C01 #YLegend[10.10.1.1_traceroute]: Number of Hops #Legend1[10.10.1.1_traceroute]: Hops #Legend3[10.10.1.1_traceroute]: Peak Hops #LegendI[10.10.1.1_traceroute]: Hops: #ShortLegend[10.10.1.1_traceroute]: #routers.cgi*ShortDesc[10.10.1.1_traceroute]: Hop Count #routers.cgi*Options[10.10.1.1_traceroute]: fixunit integer maximum nomax noo nopercentile nototal #routers.cgi*Icon[10.10.1.1_traceroute]: graph-sm.gif ################################################################################################################ ################################################## Interfaces ################################################## ################################################################################################################ Target[10.10.1.1_outside]: #outside:abcdEFGH@10.10.1.1:::::2 #Since this is an Internet connection, it only provides 20 MBit/s = 2,5 MByte/s = 2500000 Byte/s: #If different speeds are present for outgoing/incoming, specify the MaxBytes1,2 values MaxBytes[10.10.1.1_outside]: 2500000 #MaxBytes1[10.10.1.1_outside]: 2000000 #MaxBytes2[10.10.1.1_outside]: 125000 #But the hardware interface actually hast 1 GBit/s: AbsMax[10.10.1.1_outside]: 125000000 Title[10.10.1.1_outside]: Outside -- FIREWALLNAME #noHC[10.10.1.1_outside]: yes routers.cgi*ShortName[10.10.1.1_outside]: Outside routers.cgi*GraphStyle[10.10.1.1_outside]: mirror routers.cgi*Summary[10.10.1.1_outside]: 10.10.1.1_shortsummary Target[10.10.1.1_inside]: #inside:abcdEFGH@10.10.1.1:::::2 MaxBytes[10.10.1.1_inside]: 125000000 Title[10.10.1.1_inside]: Inside -- FIREWALLNAME routers.cgi*ShortName[10.10.1.1_inside]: Inside routers.cgi*GraphStyle[10.10.1.1_inside]: mirror #If an interface called "DMZ" is used, the following lines are already correct configured Target[10.10.1.1_DMZ]: #DMZ:abcdEFGH@10.10.1.1:::::2 MaxBytes[10.10.1.1_DMZ]: 125000000 Title[10.10.1.1_DMZ]: DMZ -- FIREWALLNAME routers.cgi*ShortName[10.10.1.1_DMZ]: DMZ routers.cgi*GraphStyle[10.10.1.1_DMZ]: mirror #Example for a normal Interface with 1 GBit/s interface Target[10.10.1.1_INTERFACENAME]: #INTERFACENAME:abcdEFGH@10.10.1.1:::::2 MaxBytes[10.10.1.1_INTERFACENAME]: 125000000 Title[10.10.1.1_INTERFACENAME]: INTERFACENAME -- FIREWALLNAME routers.cgi*ShortName[10.10.1.1_INTERFACENAME]: INTERFACENAME routers.cgi*GraphStyle[10.10.1.1_INTERFACENAME]: mirror ################################################################################################################ ################################################ Short Summary ################################################# ################################################################################################################ #Shows no interfaces, except the Outside interface, and: CPU, Connections, VPN Sessions, Ping Outside routers.cgi*ShortDesc[10.10.1.1_shortsummary]: Short Summary |
Sample Graphs
Here is a gallery with all the graphs from that template (all in the “weekly” view):
And here a few graphs with the values over two years to see the trends:


I suggest you guys that you must be familiar with the installation procedure of the MRTG with RRDtool and Routers2.
HI Johannes!
Thnaks for your fabulous script to monitor ASA. I’m using it but I have a little problem.
I have set the:
options[_]: growright,bits
before your code/script, but MTRG is displaying the graphs from right to left (growlefth) , instead from left to right (growrigth)
Could you help me? What I am doing wrong?
Thnx!
Hi Francisco,
well, I am not sure why this doesn’t work. Are you using merely MRTG or also RRDtool and Routers2? (See my tutorial here: https://weberblog.net/mrtg-with-rrdtool-and-routers2-installation-from-scratch/)
Since I am using Routers2, I don’t need this growright thing.
Can you try to set the options for a single target? E.g.,
Options[1.2.3.4_cpu]: growright, bits
What about your other devices? Does this option work?
Hi All,
I am using MRTG and Kaseya Traverse for monitoring my routers.
But i have and issue with them, when i compare the traffic IN & OUT values of both they seems to be different.
Kaseya Traverse shows the kbps, so i have configured same in MRTG so that i can get the value in kbps, but no luck.
Can any one help on this……
Thanks in advance….
Hello,
per default MRTG queries the inOctets and outOctets via SNMP. MRTG then displays the values in bits/s (bps) in the graphs.
Unfortunately I have not yet worked with Kaseya Traverse. I don’t know how it’s working. Are they using SNMP, too? If so, please verify (e.g. with tcpdump/Wireshark) which OIDs are queried and compare them with MRTG. If you have Cisco devices you can show the interface stats on the devices with “show interfaces counters”.
In general, you are absolutely correct: Both systems should display almost the same values!
Cheers,
Johannes